Viewing historical graphs/tables – Brocade Network Advisor IP User Manual v12.1.0 User Manual
Page 1100
1046
Brocade Network Advisor IP User Manual
53-1002947-01
IP historical performance monitoring
35
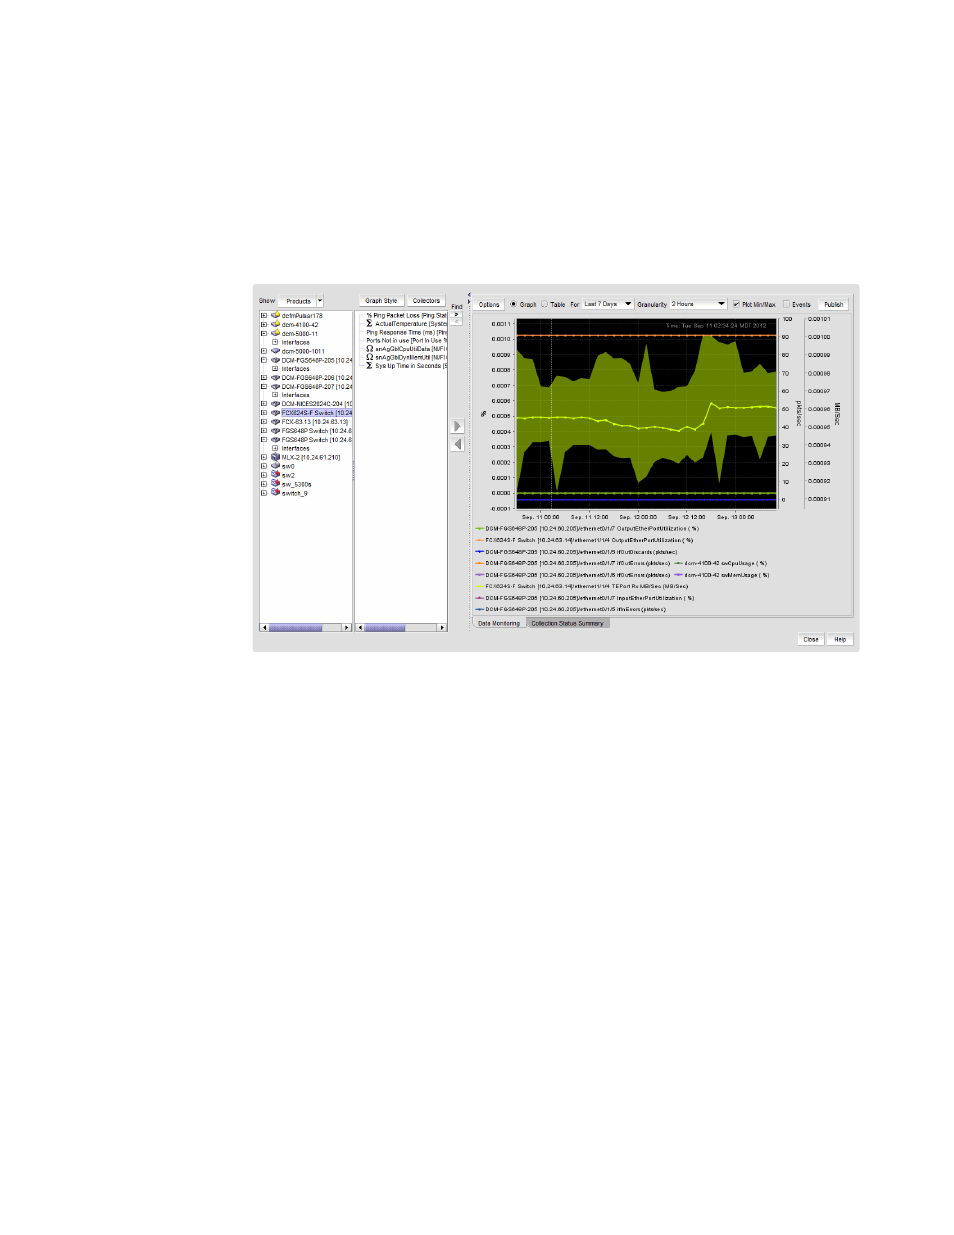
Viewing Historical Graphs/Tables
1. Select Monitor > Performance > Historical Graphs/Tables.
2. Select the Data Monitoring tab.
The main features are a tree structure and a graph area. You can collapse the tree structure to
expand the graph area.
FIGURE 404
Historical Graphs/Tables Data Monitoring tab
3. Use the Show selector to toggle the tree structure display in the left panel between Products
and Collectibles.
•
Select Products and the left panel displays the tree structure of devices and device
interfaces on the network being polled for collectible data. The right panel displays
measures currently being collected for the selected product or port in the left panel.
Measures also display for SAN products, ports, and FCIP tunnels that appear in the device
tree. Refer to
on page 1047 for examples. In
addition, measures collected for attached wireless access point (AP) and devices and
controllers display. Refer to
on page 1048 for an example.