Brocade Network Advisor IP User Manual v12.1.0 User Manual
Page 1188

1134
Brocade Network Advisor IP User Manual
53-1002947-01
Viewing PoE performance
37
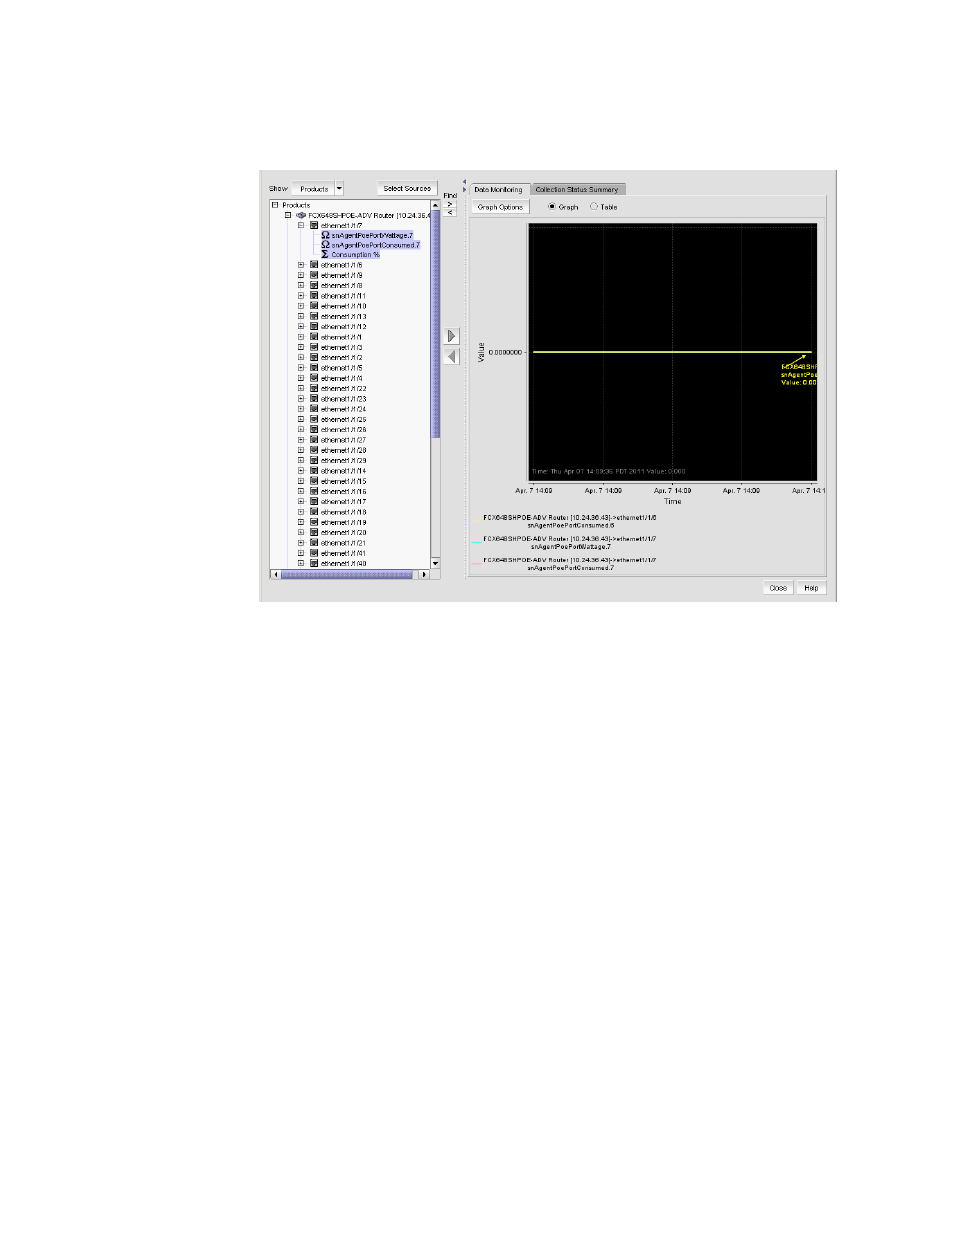
The Real Time Power Graphs/Tables dialog box displays.
FIGURE 449
Real Time Power Graphs/Tables dialog box
4. Select the measures you want to include and click the right arrow button to display it on the
Data Monitoring tab.
Port power measures include the following:
•
Allocation (W) — snAgentPoePortWattage
•
Consumption (W) — snAgentPoePortConsumed
•
Consumption %
5. Click the Data Monitoring tab to view a performance monitoring graph or table.
•
Click the Graph option to view a performance graph.
The legend under the graph shows what data each color represents. To configure graph
options, refer to
“Configuring the performance graph”
•
Click the Table option to view a performance table.
The first column displays the time of the collection. The remaining columns display the
value of each collectible at the specified time. There is one column for every collectible you
selected to display.
