Brocade Network Advisor IP User Manual v12.1.0 User Manual
Page 1085
Brocade Network Advisor IP User Manual
1031
53-1002947-01
IP real-time performance monitoring
35
•
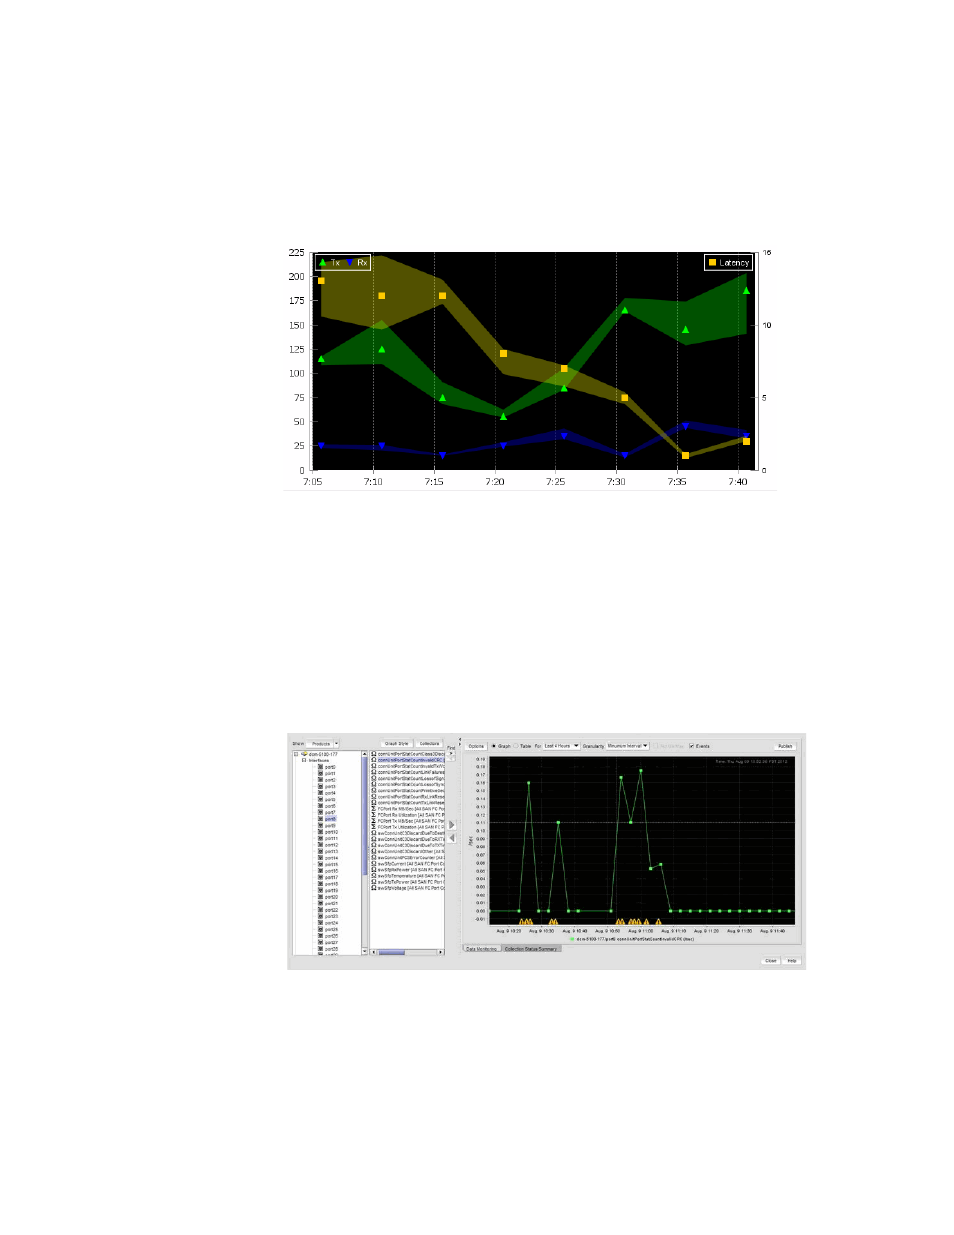
(Historical graphs and monitors only) Plot Min/Max - Plots minimum and maximum values
along with the average data. The range between the minimum and maximum values will
be represented by the width of a color band surrounding the data points as shown in the
following illustration. Note that this option is not available if you select Minimum Interval
granularity. It also does not apply and is not available for Real Time Performance graphs.
FIGURE 393
Data points graph
•
Show Events - Select to display advanced monitoring service (AMS) violation events
received during the chart time range and master log events logged on the same product as
the measure being plotted. Each event will be represented by the same severity icon that
is shown in the master log (refer to icons a bottom of following graph). Hovering the cursor
over the icon displays details of the violation, such as violation time, switch/port
information, violated rule name, and violated rule condition. Monitoring and Alerting Policy
Suite (MAPS) violations are plotted for a product or port level measure (whichever is
selected) during the plotted time range. The show events graph is shown in
FIGURE 394
Show events graph