Ag Leader InSight Ver.8.0 Users Manual User Manual
Page 172
158
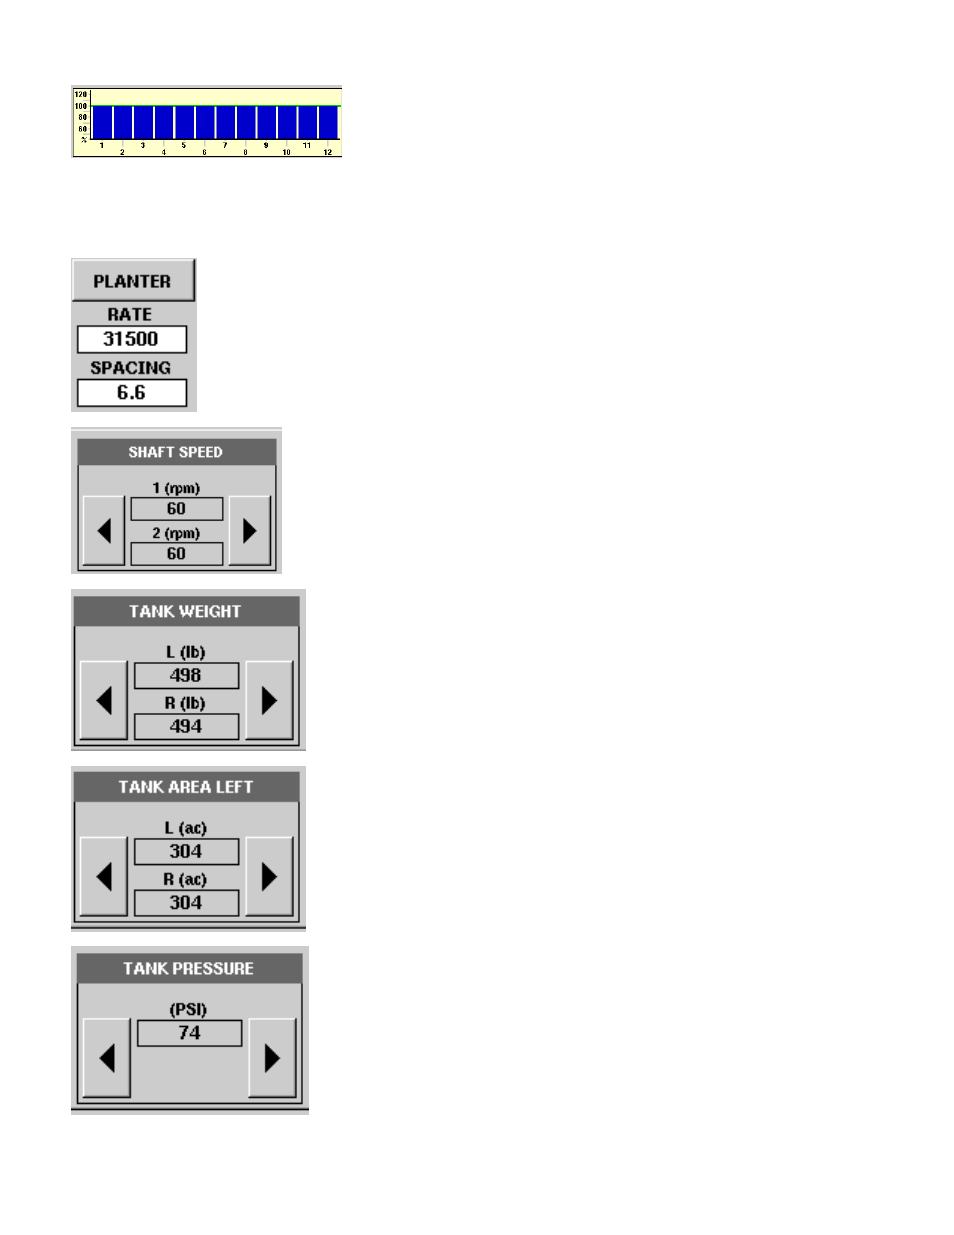
The KINZE Population Monitor Bar Graph consists of a number
of bars representing row units. Each bar’s row height represents
that row’s population in comparison with the planter average.
If a row unit drops below a user-defined threshold, the bar turns
red, an audible alarm sounds and an error message appears on the window.
The Planter button brings up the Planter Monitor Options window, which is discussed further on
Planter Monitor Options” on page
.
The Rate Display and Spacing Display are where Instantaneous Average Rate and
Spacing are displayed either for the entire planter, or for each row, depending upon
settings in Planter Monitor Options.
The Shaft Speed displays the speed of the planter drive shafts, in RPM.
The Tank Weight displays the weight of seed in each tank.
The Tank Area Left displays the number of acres (hectares) that can
be planted with the amount of seed remaining in the tanks.
The Tank Pressure displays the air pressure level for the Air Seed
Delivery (ASD) system.
- Yield Monitor 2000 Operators Manual (202 pages)
- Yield Monitor 2000 Quick Reference Sheets (2 pages)
- PF3000 Harvest & Application Operators Manual (259 pages)
- PF3000 Cotton Yield Monitor Operators Manual (149 pages)
- PF3000/PF3000Pro Harvest Master Mode Operators Manual (13 pages)
- PF3000/PF3000Pro Advanced Light Bar Operators Manual (59 pages)
- PF3000/PF3000Pro Harvest Mode Quick Reference Sheets (2 pages)
- PF3000/PF3000Pro Cotton Harvest Quick Reference Sheets (2 pages)
- PF3000/PF3000Pro Site Verification Mode Quick Reference Sheets (2 pages)
- PF3000/PF3000Pro Rawson Accu-Rate Direct Drive Quick Reference Sheets (9 pages)
- PF3000/PF3000Pro Rawson and New Leader Controllers Quick Reference Sheets (4 pages)
- PF3000/PF3000Pro Raven Controllers (with serial port) Quick Reference Sheets (4 pages)
- PF3000/PF3000Pro Raven Controllers (without serial port) Quick Reference Sheets (3 pages)
- PF3000/PF3000Pro Mid-Tech Controllers Quick Reference Sheets (4 pages)
- PF3000/PF3000Pro Dickey-john Land Manager Quick Reference Sheets (4 pages)
- PF3000/PF3000Pro Dickey-john Seed Manager Quick Reference Sheets (3 pages)
- PF3000/PF3000Pro Hiniker 8100 and 8150 Controllers Quick Reference Sheets (3 pages)
- PF3000/PF3000Pro Hiniker 8605 Controller Quick Reference Sheets (4 pages)
- PF3000/PF3000Pro TeeJet 844 Controller Quick Reference Sheets (4 pages)
- PF3000/PF3000Pro Flexicoil Flex Control Quick Reference Sheets (4 pages)
- PF3000/PF3000Pro Microtrack MT9000/Hardi 3500 Controllers Quick Reference Sheets (4 pages)
- PF3000/PF3000Pro Krohne Flow Meter Quick Reference Sheets (3 pages)
- PF3000/PF3000Pro Shaft Speed Sensor Quick Reference Sheets (3 pages)
- PF3000Pro Harvest & Application Operators Manual (294 pages)
- PF3000Pro Cotton Yield Monitor Operators Manual (168 pages)
- PFadvantage Harvest & Application Operators Manual (264 pages)
- PFadvantage Cotton Yield Monitor Operators Manual (166 pages)
- InSight Harvest Mode (4 pages)
- InSight Site Verification Mode (4 pages)
- InSight Tillage Mode (8 pages)
- InSight Flow Meter (9 pages)
- InSight Spinner Spreader (14 pages)
- InSight Strip-Till (10 pages)
- InSight NORAC UC5 (4 pages)
- InSight Direct Injection (4 pages)
- InSight Rawson and New Leader Controllers (5 pages)
- InSight Raven Serial, NL Mark V, SP6 (5 pages)
- InSight Mid-Tech Controllers (5 pages)
- InSight Direct Command Liquid (19 pages)
- Integra DirectCommand Clutch Control Quick Reference Guides (1 page)
- InSight SC Hydraulic Seed Rate Control (4 pages)
- InSight SC Stepper Seed Rate Control (3 pages)
- InSight SC KINZE PMM (3 pages)
- InSight SC Seed Tube Monitor (STMM) (16 pages)