Rate control/ logging display items, Viewable maps, Iewable – Ag Leader InSight Ver.8.0 Users Manual User Manual
Page 160
146
R
ATE
C
ONTROL
/ L
OGGING
D
ISPLAY
I
TEMS
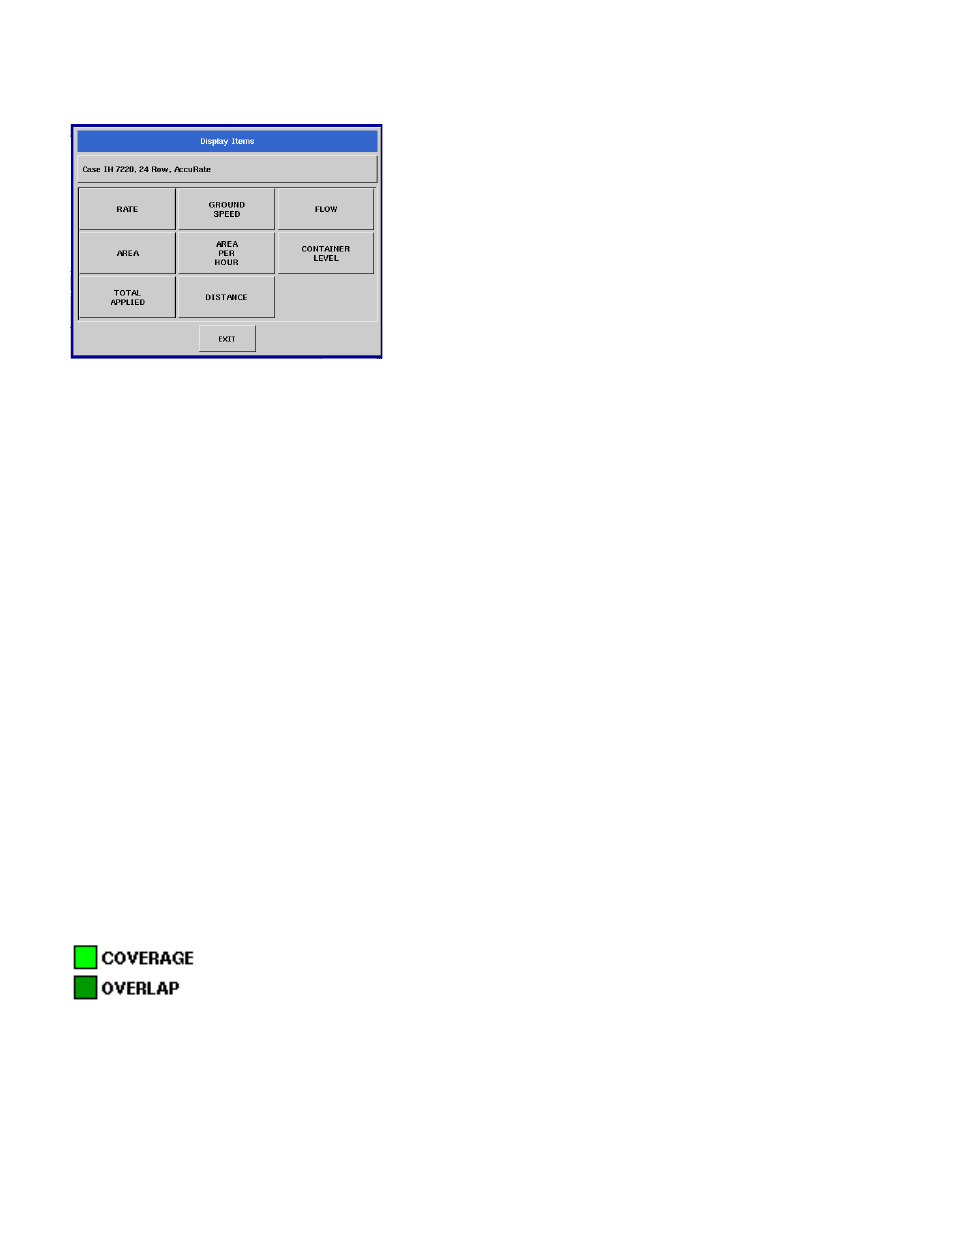
The Display Items selection dialog box can be accessed by
pressing on any one of the four display items that are active
on the Run screen.
Once the Display Items window is visible, press the display
item you would like to appear on the Run screen.
• RATE
Displays the actual rate per acre being applied.
• AREA
Displays the area that has been planted or seeded in the region.
• TOTAL APPLIED
Shows the total amount of seed applied for the region.
• GROUND SPEED
Shows the instantaneous ground speed.
• AREA PER HOUR
Shows the instantaneous productivity.
• DISTANCE
Shows the total distance driven in the region.
• FLOW
Shows the instantaneous flow rate of seed per minute.
• CONTAINER LEVEL
This is not currently being used in a Planting or Seeding operation.
V
IEWABLE
M
APS
There are four different types of viewable maps in planting depending on the type of configuration being
used. A site verification configuration will only have coverage and varieties available, a rate control/
logging configuration will have all four. The maps are accessed by pressing the button in the legend that
is either labeled Coverage, Varieties, Rate, or Rx.
The coverage map shows the area of the field that has been planted or seeded.
Overlaps are also indicated here. This legend is not editable.