Example trend monitoring report – MTS Multipurpose Elite User Manual
Page 640
3. Click the Run button (green arrow) on the Test control panel.
4. Observe the test on the Monitor Display:
•
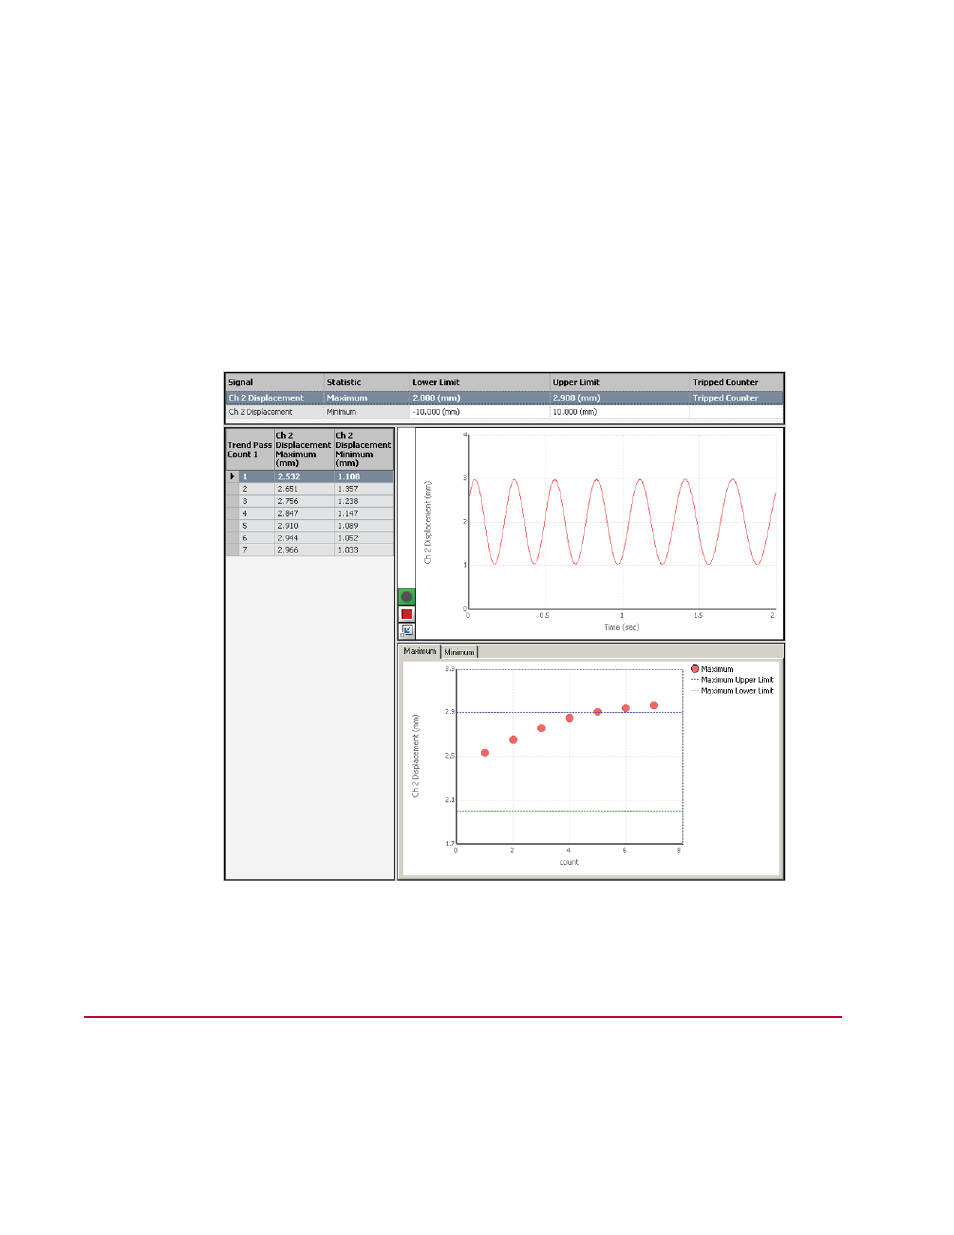
The Trend Monitoring Limits Table shows the trend limits set in the Trend Monitoring activity.
•
The Cycle Statistics table shows statistical values being calculated.
•
The Signal Scope shows the sine sweep increasing in amplitude as the frequency decreases (which
is the “trend” being monitored in this test).
•
The Trend Monitoring Statistics Chart shows the statistical values (red dots) being plotted within the
predefined trend limits.
•
The test continues until the sweep command is complete. The test does not stop when the upper
trend limit is exceeded because the workflow does not include elements to stop the test.
Monitor Display of Basic Workflow During Test-Run
Example Trend Monitoring Report
The Basic and Advanced Workflows are both configured to generate a test report in Excel at the end of
the test run. The elements in this report were defined in a report template designed with the MTS TestSuite
Report Add-In for Excel.
640 | MTS TestSuite
Appendix: Trend Monitoring