Traces properties, Line and symbol properties – MTS Multipurpose Elite User Manual
Page 518
For Docking, select where on the monitor you want the test-run display to be positioned, Top, Left, Bottom,
Right, or Fill, where the display fills the entire tab or panel.
Show Condition lets you show or hide the test-run displays, depending on the condition of the variable
expression. For example, you could set up a condition to check the variable containing the specimen type
for a Set Variable test-run display to make visible the diameter only when the specimen type is round, but
hidden for a rectangular specimen. Likewise, you can use two more Set Variable test-run displays for
width and length to be visible if the specimen type is rectangular but hidden when the specimen type is
round.
Traces Properties
A trace is the representation of a series of values plotted against another series of values. Depending on
the type of view, you can plot signal or variable data on either the Y- or X-axis.
If you define more than one trace on an axis, all the traces must have the same dimension. For example,
you cannot add a force signal trace and a displacement signal trace together on the Y-axis.
If you define more than one trace on an axis, a legend is displayed by default. You can use the Hide
Legend option to hide the legend.
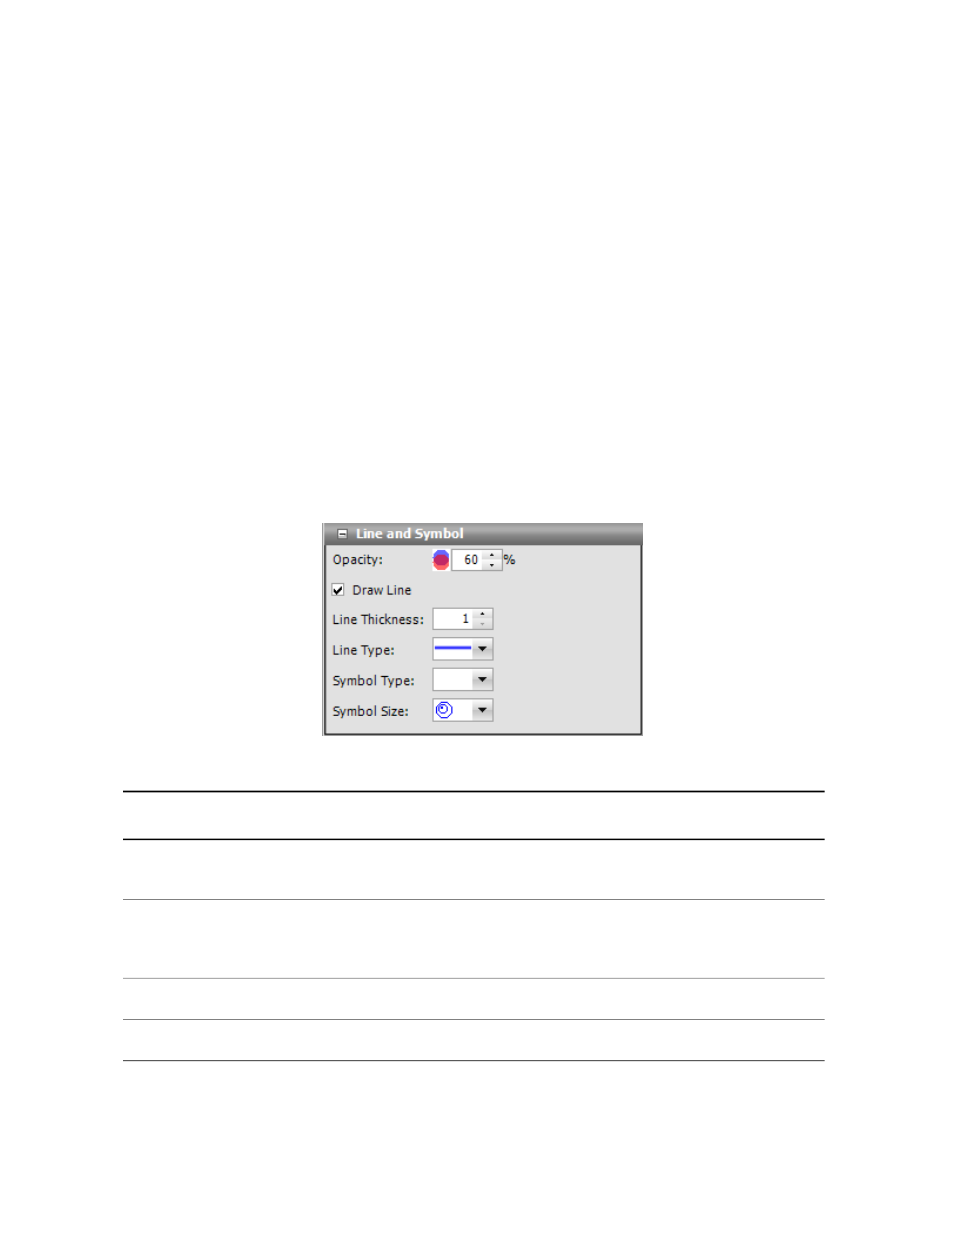
Line and Symbol Properties
Line and Symbol Display Properties
Description
Item
Adjust the opacity to better see through traces when they overlap. If you set
the opacity to a lower value, it makes the trace more transparent.
Opacity
Select this check box to draw lines between data points. Clear the Draw Line
check box and click OK to only show data points if a Symbol Type is selected;
otherwise, the trace is not drawn.
Draw Line
Select the thickness of the lines from 1 to 10 points.
Line Thickness
Select the line style as solid, dotted, or dashed.
Line Type
518 | MTS TestSuite
Test-Run Displays