Variables category, Array variable chart, About array-variable charts – MTS Multipurpose Elite User Manual
Page 527
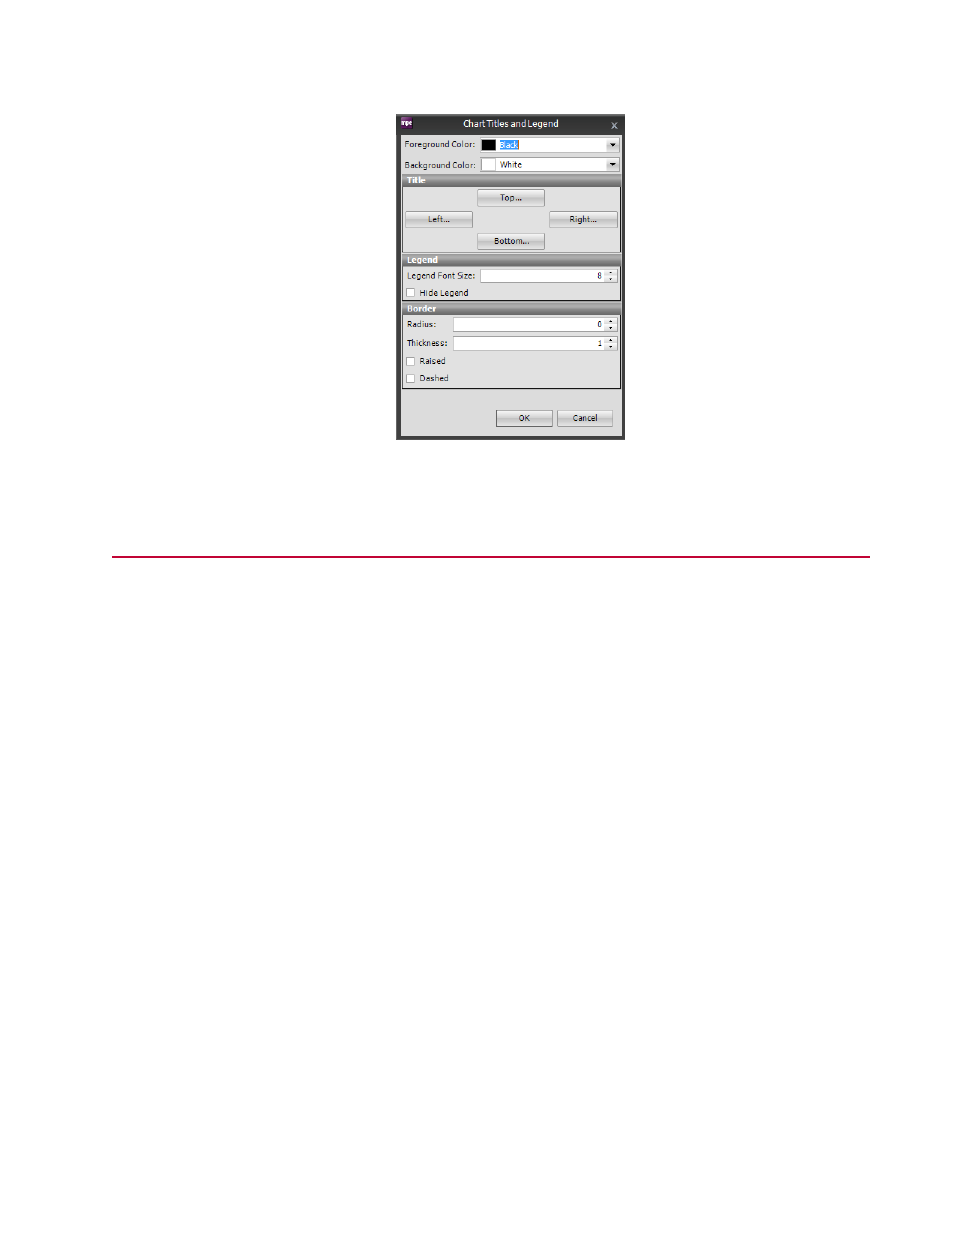
Chart Titles and Legend Window
Variables Category
This section describes the available test-run displays for variables.
Additional requirement for runtime charts
The cycle decimation filter must be correctly defined in the runtime user-interface to display variable data
in runtime charts.
Array Variable Chart
About Array-Variable Charts
The Array-Variable Chart shows data that is collected and calculated during the test and stored in arrays.
This point-by-point data calculation typically occurs as part of a Parallel Path test flow control. This chart
is used in several ways: as a test-run display; in data analysis; and as an image in reports in the Reporter
Add-In for Excel.
An Array-Variable Chart plots the entire variable array.
The Y axis of the chart must be an array variable. The X axis can be an array variable or the index of the
Y-Axis array.
To include Array-Variable Charts in reports, use the keyword $image_variablearray$.
MTS TestSuite | 527
Test-Run Displays
- Series 111 Accumulator (40 pages)
- Series 249G2 Swivels (34 pages)
- Series 201 Actuators (40 pages)
- Series 215 Rotary Actuator (68 pages)
- Series 242 Actuators (40 pages)
- Series 244 Actuators (68 pages)
- Series 247 Actuators (40 pages)
- Series 248 Actuators (46 pages)
- 709 Alignment System (158 pages)
- Series 609 Alignment Fixture (70 pages)
- 494 Controller Hardware FT 40 (344 pages)
- ReNew Technical Reference (50 pages)
- DCPD Measurement System (46 pages)
- Bionix EnviroBath (40 pages)
- FGW900 High-temperature Furnace (38 pages)
- Model 409.83 Temperature Controller (40 pages)
- Series 651 Environmental Chambers (30 pages)
- Series 653 High-Temperature Furnaces (38 pages)
- Series 658 Environmental Chamber (24 pages)
- Series FEC Environmental Chamber (48 pages)
- Model 685.53 Grip Control Module (24 pages)
- Series 685 Hydraulic Grip Supply (48 pages)
- Bend Fixture-10 kN (2 pages)
- Grip-Manual Bend Fixture-100 kN (2 pages)
- Grip-Manual Bollard-2 kN (2 pages)
- Grip-Manual Bollard-500 N (2 pages)
- Compression Platen-100 kN-100mm (2 pages)
- Compression Platen-100 kN-150mm (2 pages)
- Compression Platen-100 kN-200mm (2 pages)
- Compression Platen-20 kN (2 pages)
- Compression Platen-20 kN-100mm (2 pages)
- Compression Platen-20 kN-200mm (2 pages)
- Compression Platen-20 kN-SST (2 pages)
- Compression Platen-500 N FYC502A (2 pages)
- Compression Platen-500 N FYB502A (2 pages)
- Compression Platen-500 N-50mm (2 pages)
- Grip-Pneumatic Vise-Style-1 kN (2 pages)
- Pneumatic Bollard-500 N (2 pages)
- Scissor-Style-2 kN (2 pages)
- Scissor-Style-5 kN (2 pages)
- Screw-Style-5 kN (2 pages)
- Screw-Style-5 kN-SST (2 pages)
- Bend Fixture-1000 kN (2 pages)
- Bend Fixture-300 kN (2 pages)
- Bolt Grips (32 pages)