Chart titles and legend, Signal category – MTS Multipurpose Elite User Manual
Page 558
Description
Item
Show the values of two points, the difference between their values, and the
slope of a line drawn through the two points.
Show Delta and
Slope Labels
Specify the number of rows used to arrange the labels, delta, and slope. Click
the up-arrow or down-arrow to increase or decrease the number of rows. The
value range is 1 - 6.
Number of Rows
Chart Titles and Legend
Titles and Legends Button
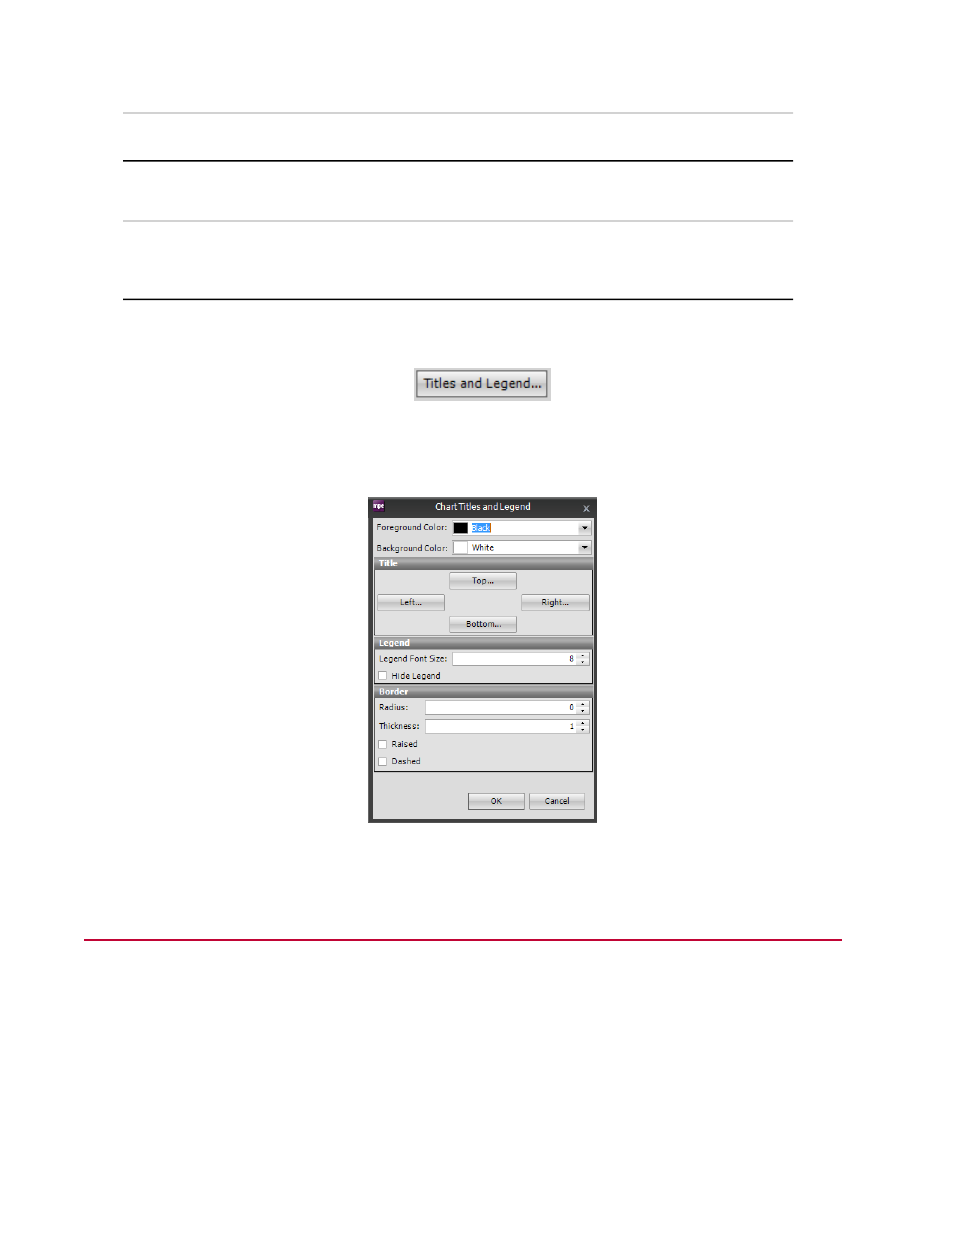
Click the Titles and Legends button to open the Chart Titles and Legend window where you can configure
the details of your display and legend, such as color, font size, location in the window, and border details.
Chart Titles and Legend Window
Signal Category
This section describes the available test-run displays for signals.
558 | MTS TestSuite
Test-Run Displays
- Series 111 Accumulator (40 pages)
- Series 249G2 Swivels (34 pages)
- Series 201 Actuators (40 pages)
- Series 215 Rotary Actuator (68 pages)
- Series 242 Actuators (40 pages)
- Series 244 Actuators (68 pages)
- Series 247 Actuators (40 pages)
- Series 248 Actuators (46 pages)
- 709 Alignment System (158 pages)
- Series 609 Alignment Fixture (70 pages)
- 494 Controller Hardware FT 40 (344 pages)
- ReNew Technical Reference (50 pages)
- DCPD Measurement System (46 pages)
- Bionix EnviroBath (40 pages)
- FGW900 High-temperature Furnace (38 pages)
- Model 409.83 Temperature Controller (40 pages)
- Series 651 Environmental Chambers (30 pages)
- Series 653 High-Temperature Furnaces (38 pages)
- Series 658 Environmental Chamber (24 pages)
- Series FEC Environmental Chamber (48 pages)
- Model 685.53 Grip Control Module (24 pages)
- Series 685 Hydraulic Grip Supply (48 pages)
- Bend Fixture-10 kN (2 pages)
- Grip-Manual Bend Fixture-100 kN (2 pages)
- Grip-Manual Bollard-2 kN (2 pages)
- Grip-Manual Bollard-500 N (2 pages)
- Compression Platen-100 kN-100mm (2 pages)
- Compression Platen-100 kN-150mm (2 pages)
- Compression Platen-100 kN-200mm (2 pages)
- Compression Platen-20 kN (2 pages)
- Compression Platen-20 kN-100mm (2 pages)
- Compression Platen-20 kN-200mm (2 pages)
- Compression Platen-20 kN-SST (2 pages)
- Compression Platen-500 N FYC502A (2 pages)
- Compression Platen-500 N FYB502A (2 pages)
- Compression Platen-500 N-50mm (2 pages)
- Grip-Pneumatic Vise-Style-1 kN (2 pages)
- Pneumatic Bollard-500 N (2 pages)
- Scissor-Style-2 kN (2 pages)
- Scissor-Style-5 kN (2 pages)
- Screw-Style-5 kN (2 pages)
- Screw-Style-5 kN-SST (2 pages)
- Bend Fixture-1000 kN (2 pages)
- Bend Fixture-300 kN (2 pages)
- Bolt Grips (32 pages)