Monitor for change, Line and symbol properties – MTS Multipurpose Elite User Manual
Page 497
Monitor for Change
You can monitor a variable for change by selecting an existing variable from the drop-down list or create
a new one by selecting
about new numeric variables, see
(p. 167)). Every time a change occurs to
the variable you choose to monitor (for the Cycle Statistics Table, Cycle Time Chart, History Chart,
Hysteresis Chart), the data in the view is updated. The default value is Current Cycle Index, which stores
the index number of the current cycle count. Other variables listed in this box are variables specified in
the Save Variables box of the Map Variables window.
To plot the updated data, it must also meet the cycle decimation filter selection criteria.
For example, if you select Current Cycle Index (which is used by the Cycle + DAQ and Custom Waveform
+ DAQ activities to count cycles), the application shows the results only when all of the following are true:
•
The Current Cycle Index variable changes (when the cycle count changes).
•
The cycle meets the selection criteria set in the Cycle Decimation Filter Selection window.
•
The update interval set in the Cycle Decimation Filter Selection window occurs when the selected cycle
is complete but before the next selected cycle.
Monitor for Change is also used to select the Counter variable in the block Information of DAQ.
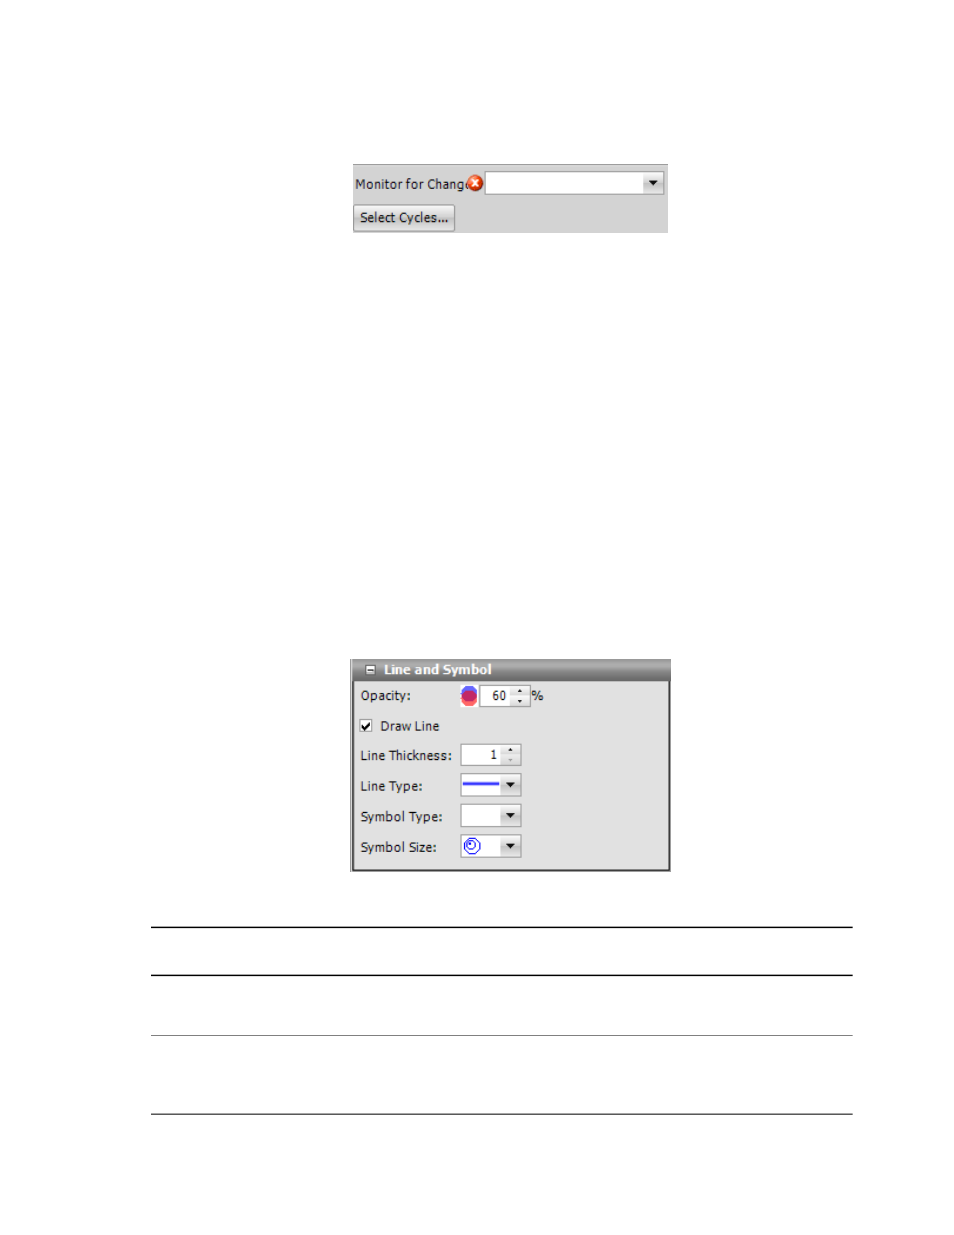
Line and Symbol Properties
Line and Symbol Display Properties
Description
Item
Adjust the opacity to better see through traces when they overlap. If you set
the opacity to a lower value, it makes the trace more transparent.
Opacity
Select this check box to draw lines between data points. Clear the Draw Line
check box and click OK to only show data points if a Symbol Type is selected;
otherwise, the trace is not drawn.
Draw Line
MTS TestSuite | 497
Test-Run Displays