X-axis and y-axis advanced properties – MTS Multipurpose Elite User Manual
Page 525
Description
Item
Set the number of significant digits displayed in the labels along the X-axis and
Y-axis. Only non-zero digits are shown after the decimal point to avoid
overcrowding in the label area next to the axis.
Label Digits
Set the color of the associated trace or axis. Click the down-arrow and select a
color from the list.
Color
Select the check box to show grid lines on the chart. Deselect the check box to
suppress the grid lines.
Draw Grid Lines
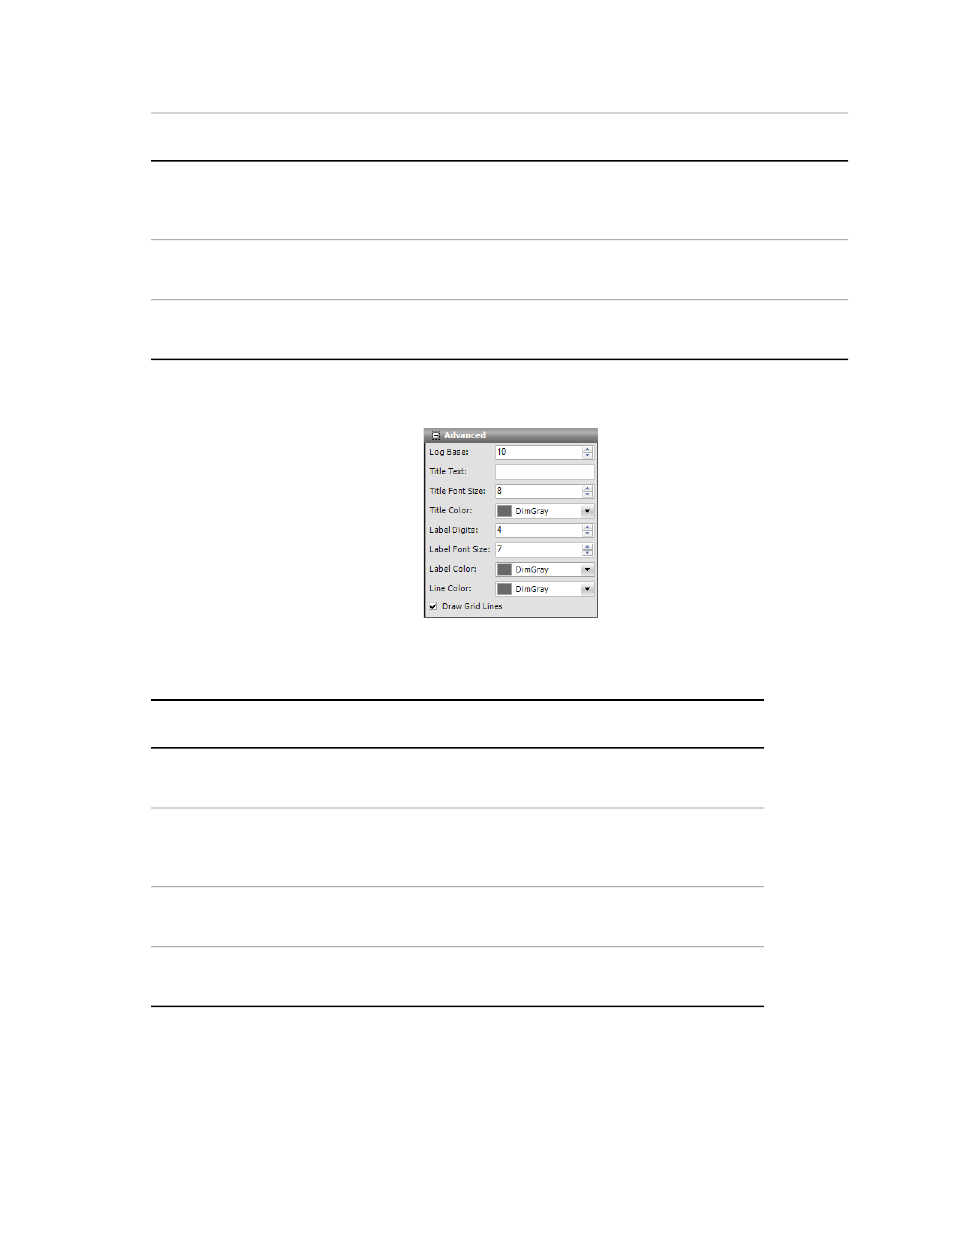
X-Axis and Y-Axis Advanced Properties
X-Axis and Y-Axis Advanced Window
X-Axis and Y-Axis Advanced Properties
Description
Item
Set the base for displaying values in a logarithmic format. Click the
up-arrow or down-arrow to raise or lower the base.
Log Base
Set the number of significant digits displayed in the labels along the
X-axis and Y-axis. Only non-zero digits are shown after the decimal
point to avoid overcrowding in the label area next to the axis.
Label Digits
Set the color of the associated trace or axis. Click the down-arrow
and select a color from the list.
Color
Select the check box to show grid lines on the chart. Deselect the
check box to suppress the grid lines.
Draw Grid Lines
MTS TestSuite | 525
Test-Run Displays