MTS Multipurpose Elite User Manual
Page 637
changes into a splitter cursor (resembling a cross-hairs). It may take several clicks to get the mouse
to change to the splitter curser.
Trend Monitoring Limits Table
By default, the Trend Monitoring Limits Table (1) shows all of the limits (lower and upper) for all of the
signals and statistics specified in the Trend Monitoring activity. If desired, you can select a subset of signals
and statistics on the Properties panel.
Cycle Statistics Table
The Cycle Statistics Table (2) shows values from the Trend Monitoring or any other block data acquisition.
The Monitor for Change property specifies the pass count of the activity. If multiple passes are available,
the Variable List property displays each pass.
Signal Scope
The Signal Scope (3) shows feedback response versus time. It is configured so that the Run Mode control
is set to Program Control. This stops and freezes the scope trace when the test stops due to a tripped
trend limit. This allows you to review the raw data on the Monitor tab when the trend limit trips.
Note:
You can adjust the trace time as desired to match the pass duration It is best practise to set the
trace time slightly longer than the pass duration.
Trend Monitoring Statistics Chart
The Trend Monitoring Statistics Chart (4) is configured with tabs (added with the Tabs tool in the Toolbox)
to allow a separate plot of each signal statistic against its own limit. Because pass statistics are discrete
values, a symbol without line (red dot) is selected to show each value.
The control (button) you use to add limits automatically expands the group box and adds the limit to the
axis of the current signal trace.
The Trend Monitoring Statistics Chart allows you to plot any signal statistic and any limit on multiple axes.
You select signals or limits for this chart as you would for the Signal Scope. You plot each dimension on
a different axis, which is labeled with its associated unit.
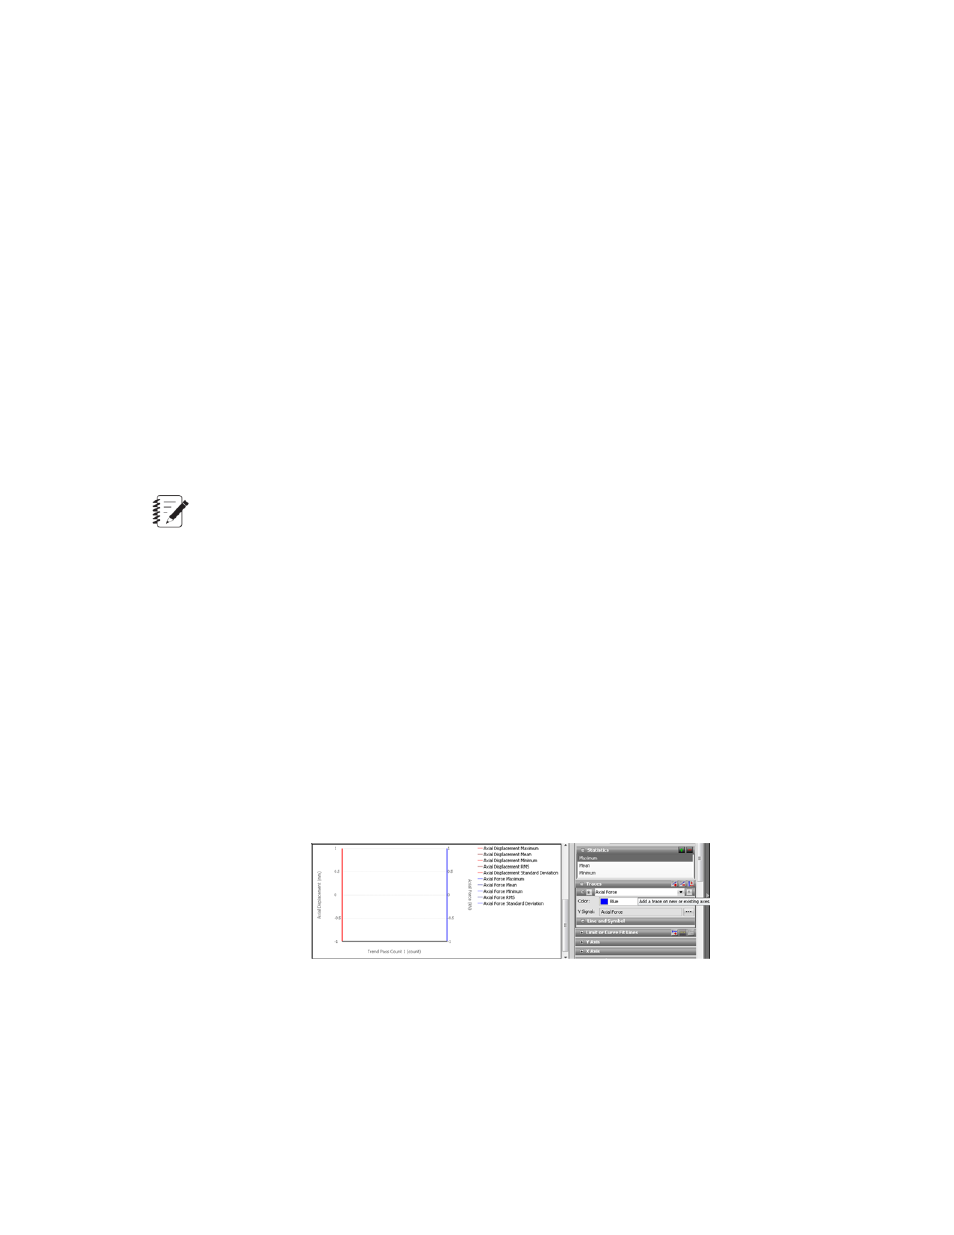
You can also plot desired statistics for specific signals. The following example shows force on the new Y2
axis.
Trend Statistics Chart Example
MTS TestSuite | 637
Appendix: Trend Monitoring