Y variable and x variable, Cycles to display property – MTS Multipurpose Elite User Manual
Page 510
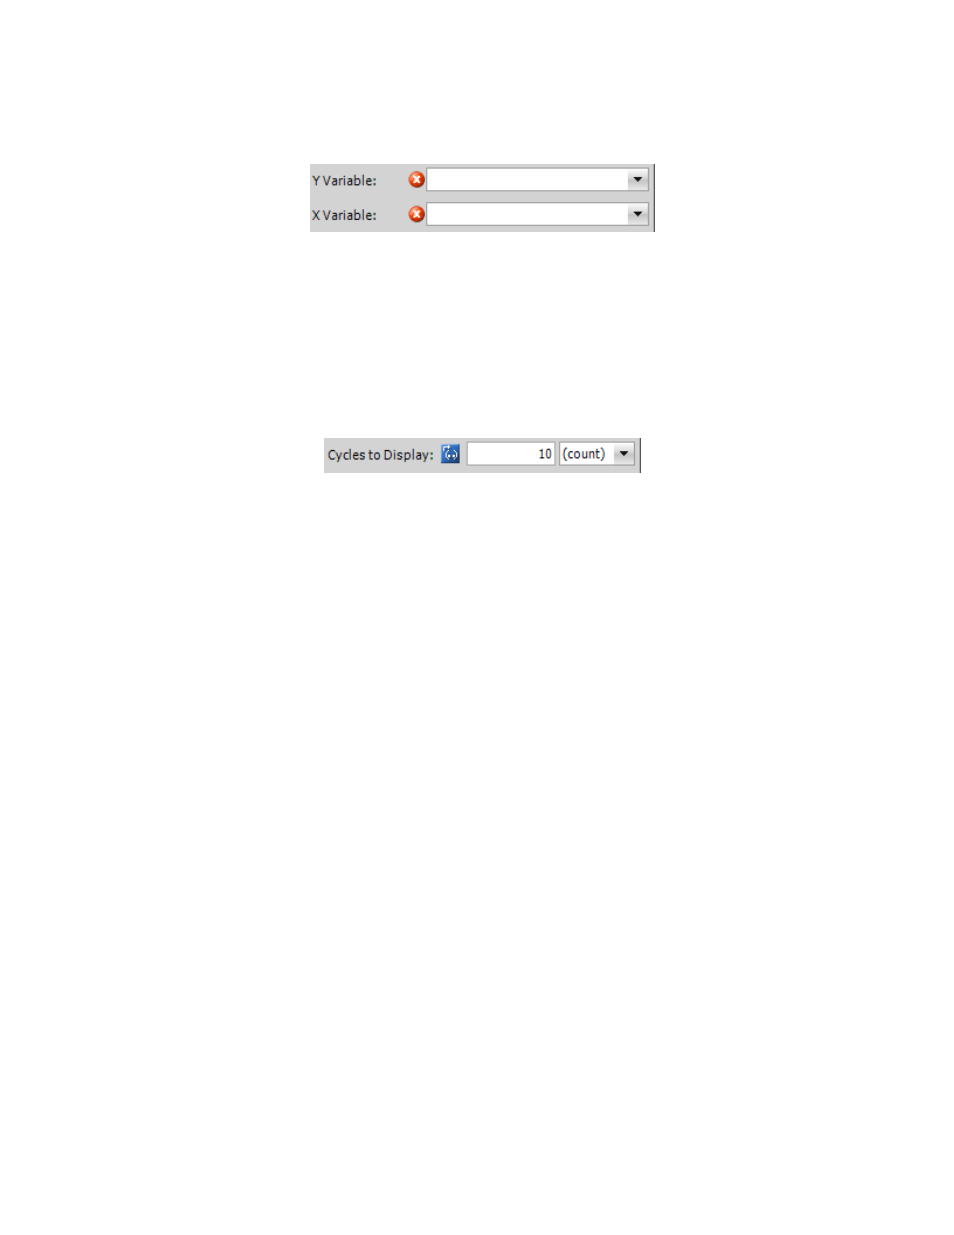
Y Variable and X Variable
Y Variable
Select a single value variable for which you want data plotted on the Y axis of the chart.
X Variable
Select a single value variable for which you want data plotted on the X axis of the chart.
Cycles to Display Property
The Cycles to Display property works in conjunction with the Cycle Decimation Filter Selection property.
Cycle Decimation Filter Selection determines when variable data should be displayed for the test cycles.
Cycles to Display specifies how many should be displayed at one time. For example, if the Cycle
Decimation Filter Selection is set to display data for every fifth cycle, and the Cycles to Display is set
to display 3, the display starts out displaying cycle numbers 5, 10, 15 and then 10, 15, 20 and then 15, 20,
25 and so forth.
There are several test-run display tools that share similar chart properties:
•
Cycle Time Chart
•
History Chart
•
Hysteresis Chart
•
Array-Variable Chart
510 | MTS TestSuite
Test-Run Displays
- Series 111 Accumulator (40 pages)
- Series 249G2 Swivels (34 pages)
- Series 201 Actuators (40 pages)
- Series 215 Rotary Actuator (68 pages)
- Series 242 Actuators (40 pages)
- Series 244 Actuators (68 pages)
- Series 247 Actuators (40 pages)
- Series 248 Actuators (46 pages)
- 709 Alignment System (158 pages)
- Series 609 Alignment Fixture (70 pages)
- 494 Controller Hardware FT 40 (344 pages)
- ReNew Technical Reference (50 pages)
- DCPD Measurement System (46 pages)
- Bionix EnviroBath (40 pages)
- FGW900 High-temperature Furnace (38 pages)
- Model 409.83 Temperature Controller (40 pages)
- Series 651 Environmental Chambers (30 pages)
- Series 653 High-Temperature Furnaces (38 pages)
- Series 658 Environmental Chamber (24 pages)
- Series FEC Environmental Chamber (48 pages)
- Model 685.53 Grip Control Module (24 pages)
- Series 685 Hydraulic Grip Supply (48 pages)
- Bend Fixture-10 kN (2 pages)
- Grip-Manual Bend Fixture-100 kN (2 pages)
- Grip-Manual Bollard-2 kN (2 pages)
- Grip-Manual Bollard-500 N (2 pages)
- Compression Platen-100 kN-100mm (2 pages)
- Compression Platen-100 kN-150mm (2 pages)
- Compression Platen-100 kN-200mm (2 pages)
- Compression Platen-20 kN (2 pages)
- Compression Platen-20 kN-100mm (2 pages)
- Compression Platen-20 kN-200mm (2 pages)
- Compression Platen-20 kN-SST (2 pages)
- Compression Platen-500 N FYC502A (2 pages)
- Compression Platen-500 N FYB502A (2 pages)
- Compression Platen-500 N-50mm (2 pages)
- Grip-Pneumatic Vise-Style-1 kN (2 pages)
- Pneumatic Bollard-500 N (2 pages)
- Scissor-Style-2 kN (2 pages)
- Scissor-Style-5 kN (2 pages)
- Screw-Style-5 kN (2 pages)
- Screw-Style-5 kN-SST (2 pages)
- Bend Fixture-1000 kN (2 pages)
- Bend Fixture-300 kN (2 pages)
- Bolt Grips (32 pages)