Adobe After Effects CS3 User Manual
Page 190

AFTER EFFECTS CS3
User Guide
185
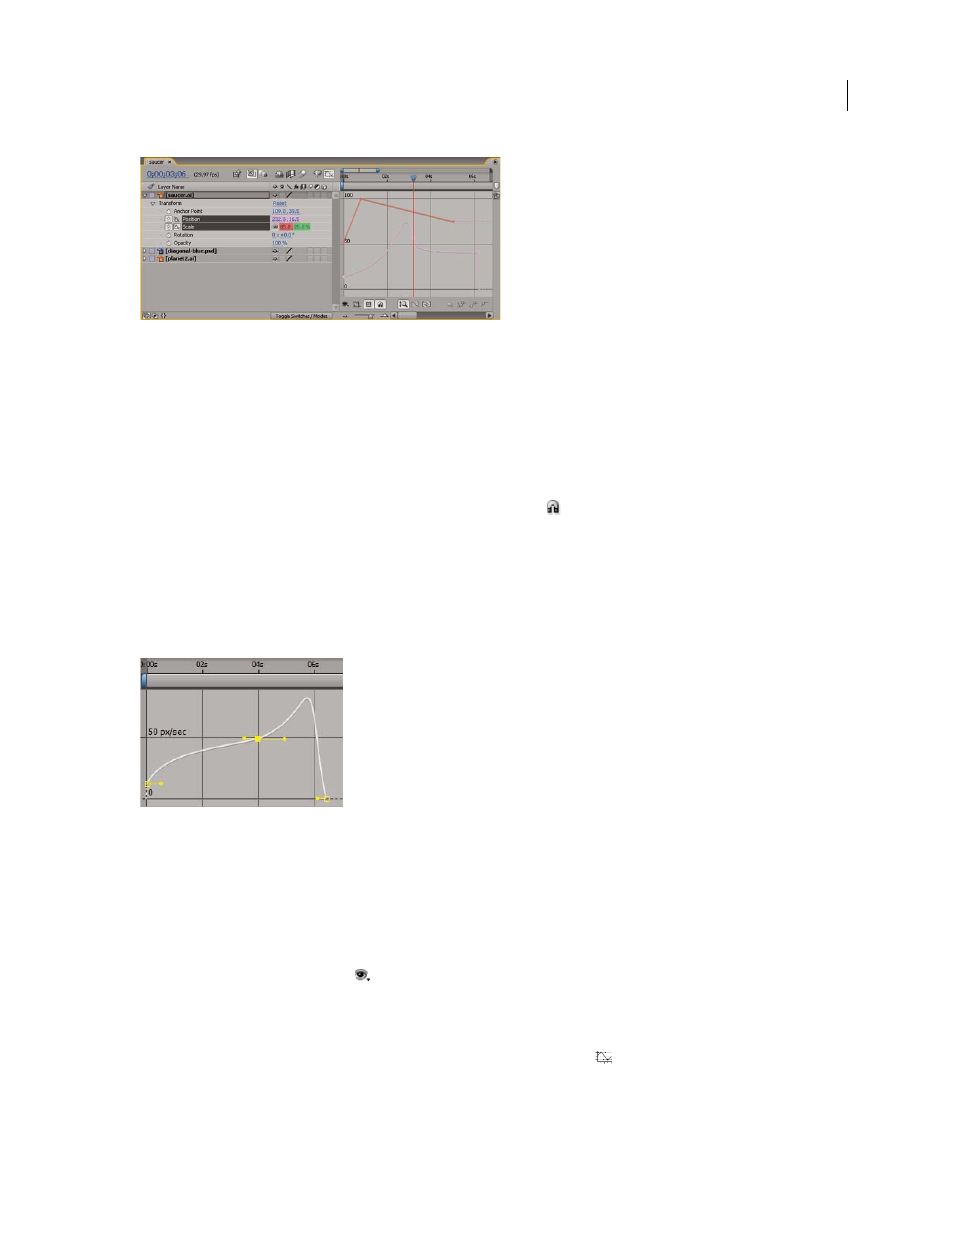
Two animated properties (Position and Scale) shown in the Graph Editor
There are two types of graphs available in the Graph Editor: value graphs, which show property values; and speed
graphs, which show rates of change of property values. For temporal properties, such as Opacity, the Graph Editor
defaults to the value graph. For spatial properties, After Effects defaults to the speed graph.
In the Graph Editor, each property is represented by its own curve. You can view and work on one property at a time,
or you can view multiple properties simultaneously. When more than one property is visible in the Graph Editor,
each property’s curve has the same color as the property’s value in the layer outline.
When you drag a keyframe in the Graph editor with the Snap button
selected, the keyframe snaps to keyframe
values, keyframe times, the current time, In and Out points, markers, the beginning and end of the work area, and
the beginning and end of the composition. When the keyframe snaps to one of these items, an orange line appears
in the Graph Editor to indicate the object you’re snapping to. Hold Ctrl (Windows) or Command (Mac OS) after
you’ve begun dragging to temporarily toggle snapping behavior.
Keyframes in Graph Editor mode may have direction handles attached to one or both sides. Direction handles are
used to control Bezier interpolation.
Keyframes in the Graph Editor with direction handles
See also
“About speed graphs” on page 210
Select which properties are shown in the Graph Editor
❖
Click the Show Properties button
at the bottom of the Graph Editor, and select from the following options:
Show Selected Properties
Displays selected properties in the Graph Editor.
Show Animated Properties
Displays animated properties of selected layers in the Graph Editor.
Show Graph Editor Set
Displays properties that have the Graph Editor switch
selected. This switch is next to the
stopwatch, to the left of the property name.
