Using the diagnostic tools, Crosspoint map, Using the diagnostic tools -1 – Clear-Com Eclipse-Omega User Manual
Page 431: Crosspoint map -1, Figure 14-1 diagnostics menu -1
Clear-Com
Eclipse Configuration Software Instruction Manual
1 4 - 1
USING THE
DIAGNOSTIC TOOLS
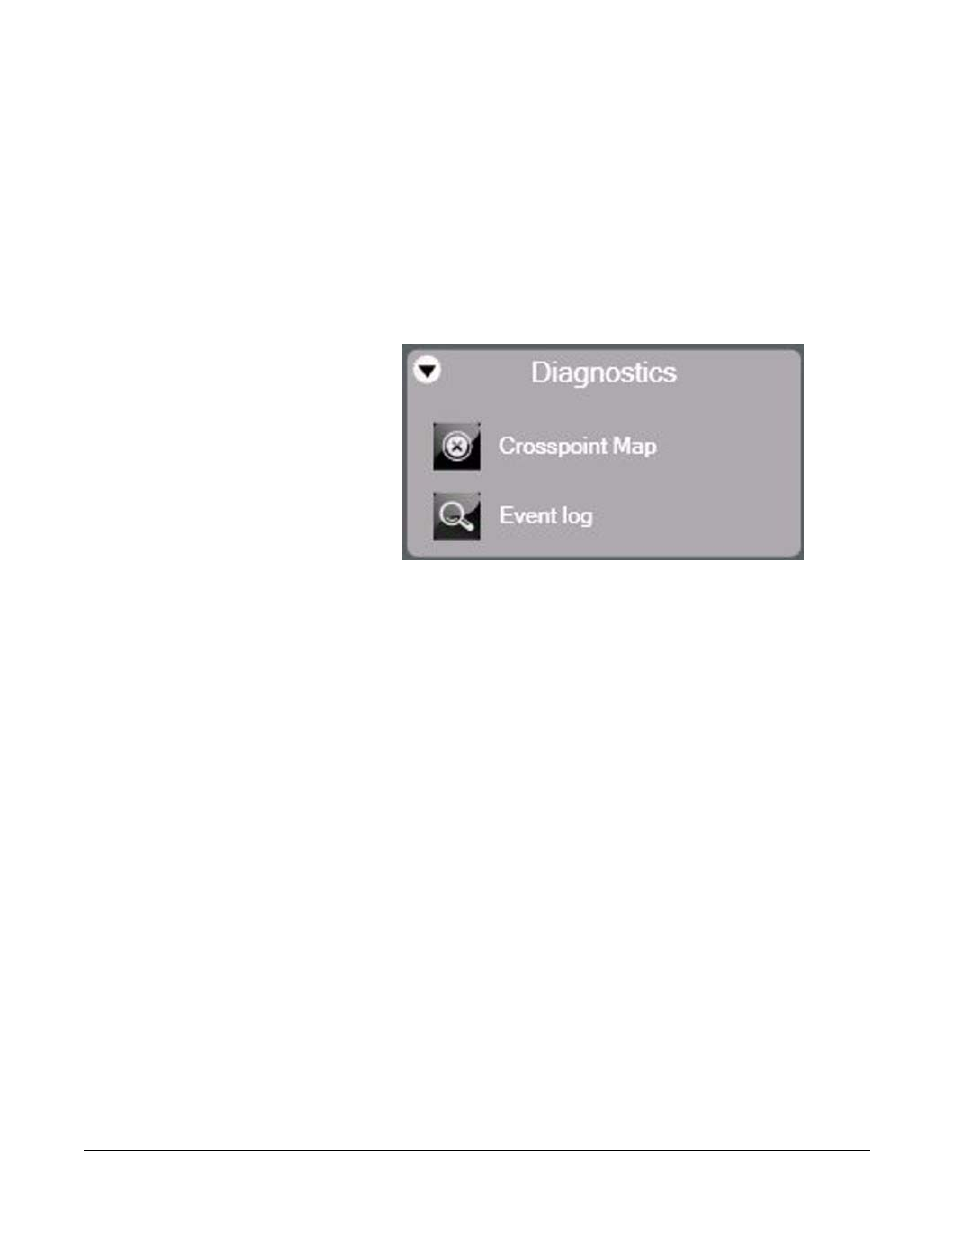
The diagnostics menu displays information about the state of the
system’s hardware and software operation that is useful for diagnosing
and preventing problems.
Figure 14-1: Diagnostics Menu
CROSSPOINT MAP
The crosspoint map gives the ECS operator a visual display of all
“crosspoints” or source-to-destination assignments in the matrix
system. The crosspoint map is a graphical representation of all inputs
and outputs in the system.
This map can be used to identify talk and listen assignments, forced
listens and blocked listens. It can also be used to make or cancel
crosspoints and to override input and output levels set up in the map.
The grey triangles denote active crosspoints, pink half circles denote
auto listen crosspoints, red crosses denote blocked listen crosspoints
and green half circles denote forced listen crosspoints.
The crosspoint map displays both the labels and the port numbers the
labels are associated with for ease of identification.
The outputs are listed down the left hand side of the table with the
output gain settings, while the inputs are listed along the top of the
table with the input gain settings.
The diagnostic tools include
crosspoint monitoring, event
log monitoring, firmware
downloading, and system
monitoring.
14