Grass Valley iControl V.4.43 User Manual
Page 221
iControl
User Guide
211
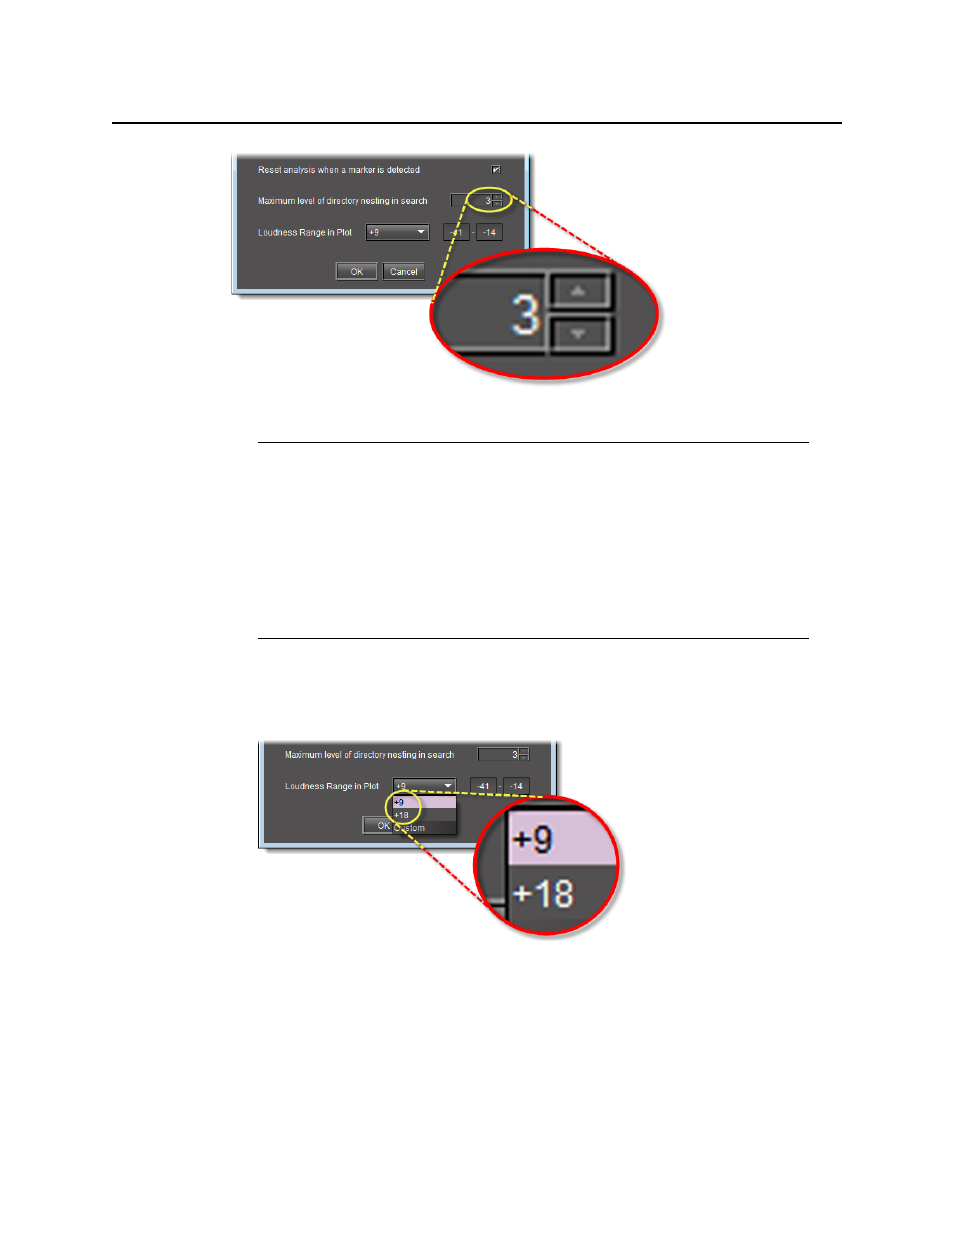
Figure 4-155
5. Next to Loudness Range in Plot, do ONE of the following:
•
Select a preset loudness range to be visible in your data plot (taking note of the range
values).
Figure 4-156
OR,
1. Select Custom.
Notes
• Selecting 3, for example, instructs Loudness Analyzer to search in the
directory named in the path you will define later when you open a loudness
log file and then within the next three nested levels down.
• If you select 0, Loudness Analyzer only searches for log files within the
immediate level of the directory named in the path.
• The deeper you search into nested directories, the slower the search
operation will be.
This manual is related to the following products: