Vectorscope, Yc waveform – Adobe Premiere Pro CS4 User Manual
Page 129

123
USING ADOBE PREMIERE PRO CS4
Monitoring assets
Last updated 11/6/2011
3
Choose any of the following from either the Reference Monitor, Program Monitor, or Source Monitor menu:
All Scopes
Displays the Vectorscope, YC Waveform, YCbCr Parade, and RGB Parade scopes in one monitor.
Vectorscope
Displays a vectorscope for viewing the chrominance in the video.
YC Waveform
Displays a waveform monitor for viewing luminance and chrominance information.
YCbCr Parade
Displays a scope with luminance (Y) and color difference (Cb and Cr) information.
RGB Parade
Displays a scope showing the red, green, and blue components in the video.
Vect/YC Wave/YCbCr Parade
Displays the Vectorscope, YC Waveform, and YCbCr Parade scope in one monitor.
Vect/YC Wave/RGB Parade
Displays the Vectorscope, YC Waveform, and RGB Parade scope in one monitor.
Vectorscope
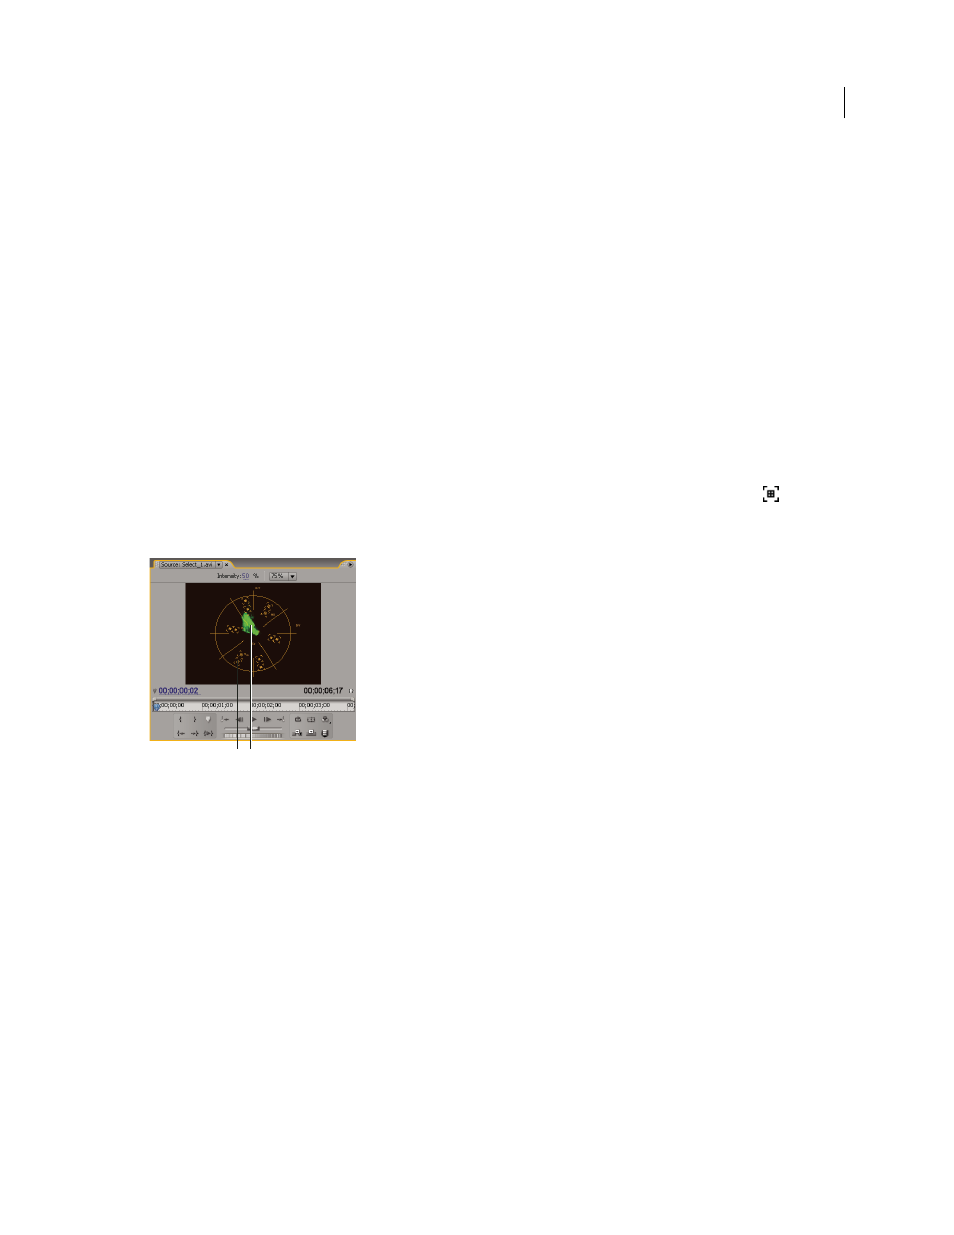
The Vectorscope displays a circular chart, similar to a color wheel, that shows the video’s chrominance information.
Saturation is measured from the center of the chart outward. Saturated, vivid colors produce a pattern some distance
from the center of the chart, while a black-and-white image produces only a dot at the center of the chart. The
particular color, or hue, of the image determines the direction (angle of the pattern). Small target boxes
indicate
where fully saturated magenta, blue, cyan, green, yellow, and red (present in a color bars test pattern) should appear.
In NTSC video, chrominance levels should not exceed these target areas.
Vectorscope
A. Target boxes B. Image profile
The Vectorscope has the following controls:
Intensity
Adjusts the brightness of the pattern display. It does not affect the video output signal.
75%
Default position. Use to check video input in which standard 75% intensity bars, like those in Premiere Pro, are used.
100%
Shows the entire range of video signal chrominance. Use with video input containing 100% intensity bars.
YC Waveform
The YC Waveform displays a graph showing the signal intensity in the video clip. The horizontal axis of the graph
corresponds to the video image (from left to right) and the vertical axis is the signal intensity in units called IRE (named
for the Institute of Radio Engineers).
B
A
