Histogram display options – Apple Final Cut Pro X (10.1.2) User Manual
Page 397
Chapter 12
Color correction
397
Histogram display options
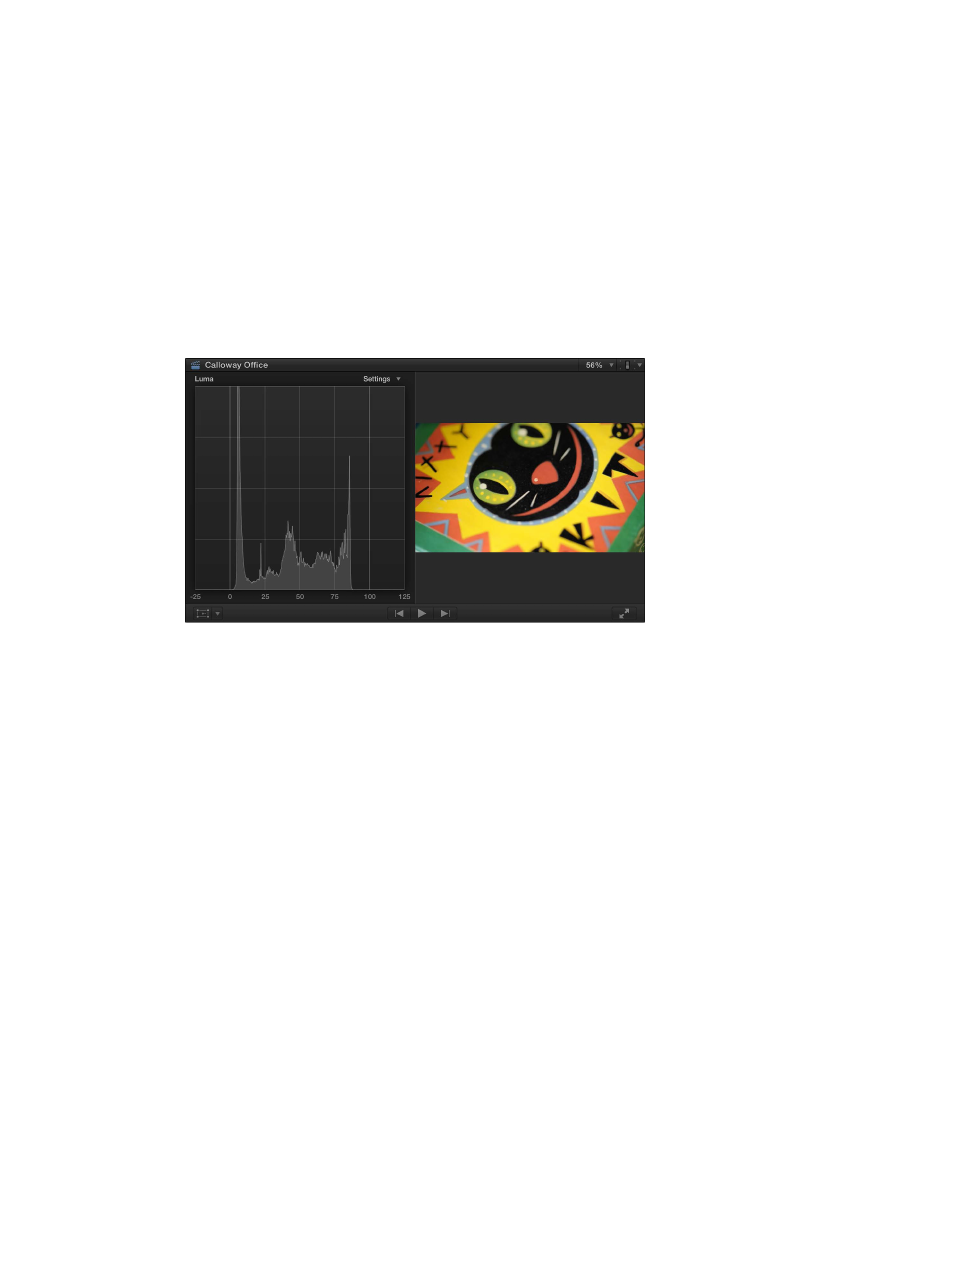
The Histogram provides a statistical analysis of the image by calculating the total number of
pixels of each color or luma level and creating a graph that shows the number of pixels at
each percentage of luma or color. Each increment of the scale from left to right represents a
percentage of luma or color, and the height of each segment of the Histogram graph shows the
number of pixels that correspond to that percentage.
The Settings pop-up menu in the upper-right corner of the Histogram provides a variety of
display options:
•
Luma: Shows only the luma component of the video. The height of the graph at each step on
the scale represents the number of pixels in the image at that percentage of luma, relative to
all the other values. For example, if an image has few highlights, the Histogram shows a large
cluster of values in the midtones.
Using the Luma Histogram view, you can quickly compare the luma of two shots so that you
can adjust their shadows, midtones, and highlights to match more closely.
The shape of the graph also helps you determine the amount of contrast in an image. A
low-contrast image has a concentrated clump of values nearer to the center of the graph. By
comparison, a high-contrast image has a wider distribution of values across the entire width of
the graph.
•
RGB Overlay: Combines waveforms for the red, green, and blue color components in one
display. If the image being examined has equal levels of two or more colors, you see the
combined color:
•
Equal levels of green and blue appear as cyan.
•
Equal levels of green and red appear as yellow.
•
Equal levels of red and blue appear as magenta.
67% resize factor