Circular bar graphs, Basic operations, Pm designer operation manual – B&B Electronics WOP-2121V-N4AE - Manual User Manual
Page 289
4
8
PM Designer Operation Manual
8-13
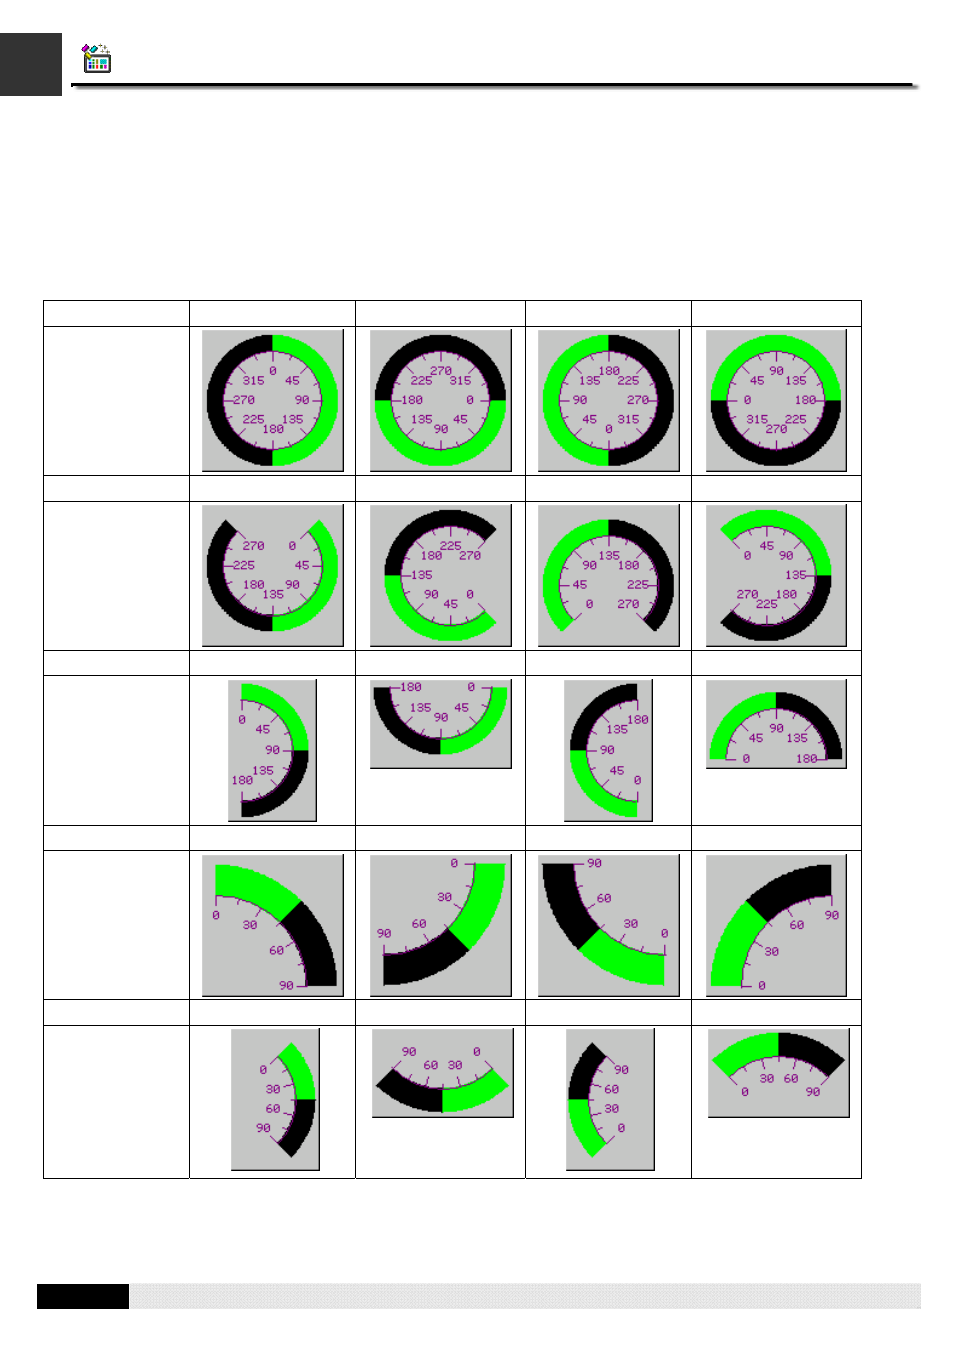
8.3. Circular Bar Graphs
8.3.1. Basic Operations
A circular bar graph shows the value of a monitored variable by displaying a circular bar with variable length. When the
value of the variable increases or decreases, the length of the circular bar increases or decreases accordingly. A circular
bar graph can have a circular scale and the scale enables you to measure the length of the bar and read the current value
for the monitored variable. The following table lists the supported styles for the circular bar graphs.
Span and Origin
360° & 90°
360° & 0°
360° & 270°
360° & 180°
Example
Span and Origin
270° & 45°
270° & 315°
270° & 225°
270° & 135°
Example
Span and Origin
180° & 90°
180° & 0°
180° & 270°
180° & 180°
Example
Span and Origin
90° & 90°
90° & 0°
90° & 270°
90° & 180°
Example
Span and Origin
90° & 45°
90° & 315°
90° & 225°
90° & 135°
Example
CHAPTER 8 GRAPHS AND CHARTS
- USOPTL4DR-LS - Datasheet (2 pages)
- ZXT9-IOA-KIT - Manual (75 pages)
- ADAM-6066 - Manual (272 pages)
- 855-11619--57 - Datasheet (2 pages)
- 851-10904 - Datasheet (2 pages)
- SS-BLT-100PR - Quick Start Guide (1 page)
- ISOCON-6 - Datasheet (2 pages)
- I-7060 - Manual (64 pages)
- AMU864 - Datasheet (2 pages)
- 714FX6-SC_ST - Manual (154 pages)
- 422LP25R - Datasheet (2 pages)
- ZP9D-115RM-LR - Manual (54 pages)
- EKI-6311GN-EU - Manual (56 pages)
- ZZ24D-NA(NB,NC,ND)-SR - Quick Start Guide (4 pages)
- ESCLP-100 - Manual (23 pages)
- 806-39753 - Datasheet (1 page)
- 485SD9RJ - Datasheet (1 page)
- 712FX4-SC_ST - Manual (154 pages)
- 850-18610 - Manual (18 pages)
- ESW208 Series - Datasheet (2 pages)
- VESR321_ML_SL - Quick Start Guide (3 pages)
- OP10 - Datasheet (1 page)
- RT3G-300_310_320_330_340-W - Configuration Manual (79 pages)
- EIRHP305-T - Datasheet (2 pages)
- EIRSP1 - Datasheet (1 page)
- 422TTL33 - Datasheet (2 pages)
- 485DRCI - Quick Start Guide (2 pages)
- I-7021_P - Datasheet (2 pages)
- NTSA-CAT5E - Datasheet (2 pages)
- 485COSR - Datasheet (2 pages)
- 855-10619--57 - Datasheet (2 pages)
- UH401SL_2KV - Datasheet (2 pages)
- 105FXE-SC(ST)-15-POE - Manual (19 pages)
- 102MC-FL_SC_ST - Manual (23 pages)
- CBL00302 - Datasheet (1 page)
- 850-18100--27 - Datasheet (2 pages)
- 850-10953-DC - Datasheet (2 pages)
- ESR904 - Datasheet (2 pages)
- 308TX-N - Datasheet (3 pages)
- 422LP25N - Datasheet (2 pages)
- 708FX2-SC_ST - Datasheet (3 pages)
- MESR321_SL_ML - Datasheet (2 pages)
- SL2736-698 - Quick Start Guide (8 pages)
- I-7188E Series - Datasheet (1 page)
- ANT-PAD58-19 - Datasheet (1 page)