Bar graphs, Basic operations, Operation options – B&B Electronics WOP-2121V-N4AE - Manual User Manual
Page 277: Pm designer operation manual
4
8
PM Designer Operation Manual
8-1
8.1. Bar Graphs
8.1.1. Basic Operations
A bar graph shows the value of a monitored variable by displaying a bar with variable length. When the value of the
variable increases or decreases, the length of the bar increases or decreases accordingly. A bar graph can have a scale
and the scale enables you to measure the length of the bar and read the current value for the monitored variable. A bar
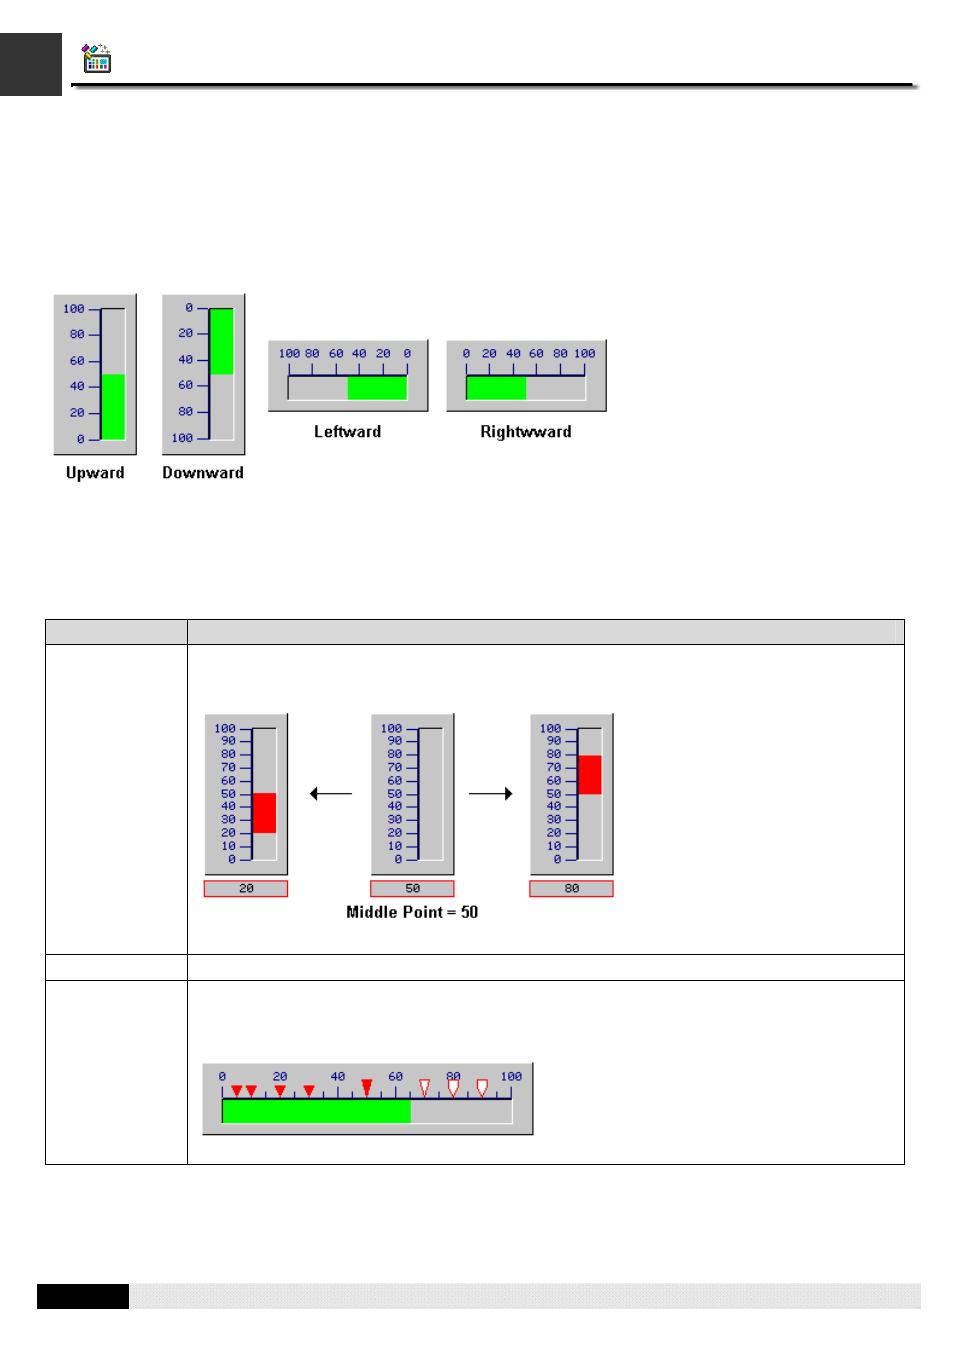
graph can display the bar in any of the following four directions:
8.1.2. Operation Options
The following operation options can be added to a bar graph to make it more informative. You need to select and set these
options in the Bar Graph property sheet.
Options
Description
Bipolar Bar
A bar graph can be configured to display the difference between the monitored value and a
specified value which is called the middle point. The bar can move both ends, so it is called bipolar
bar.
Select and set this option in the General page.
Scale
A bar graph can have a scale. Select and set this option in the Scale page.
Forward Marker
The forward marker of a bar graph can have up 12 marks. The actual number of marks and the
value of each mark are specified at runtime by the forward marker control block. The position of a
mark is determined by that mark’s value. The color of a mark is determined by the comparison
result between the monitored value and that mark’s value.
Select and set this option in the F. Marker page.
Continued
CHAPTER 8 GRAPHS AND CHARTS