Analytics developer interface – Brocade Mobility RFS Controller System Reference Guide (Supporting software release 5.5.0.0 and later) User Manual
Page 994

982
Brocade Mobility RFS Controller System Reference Guide
53-1003099-01
15
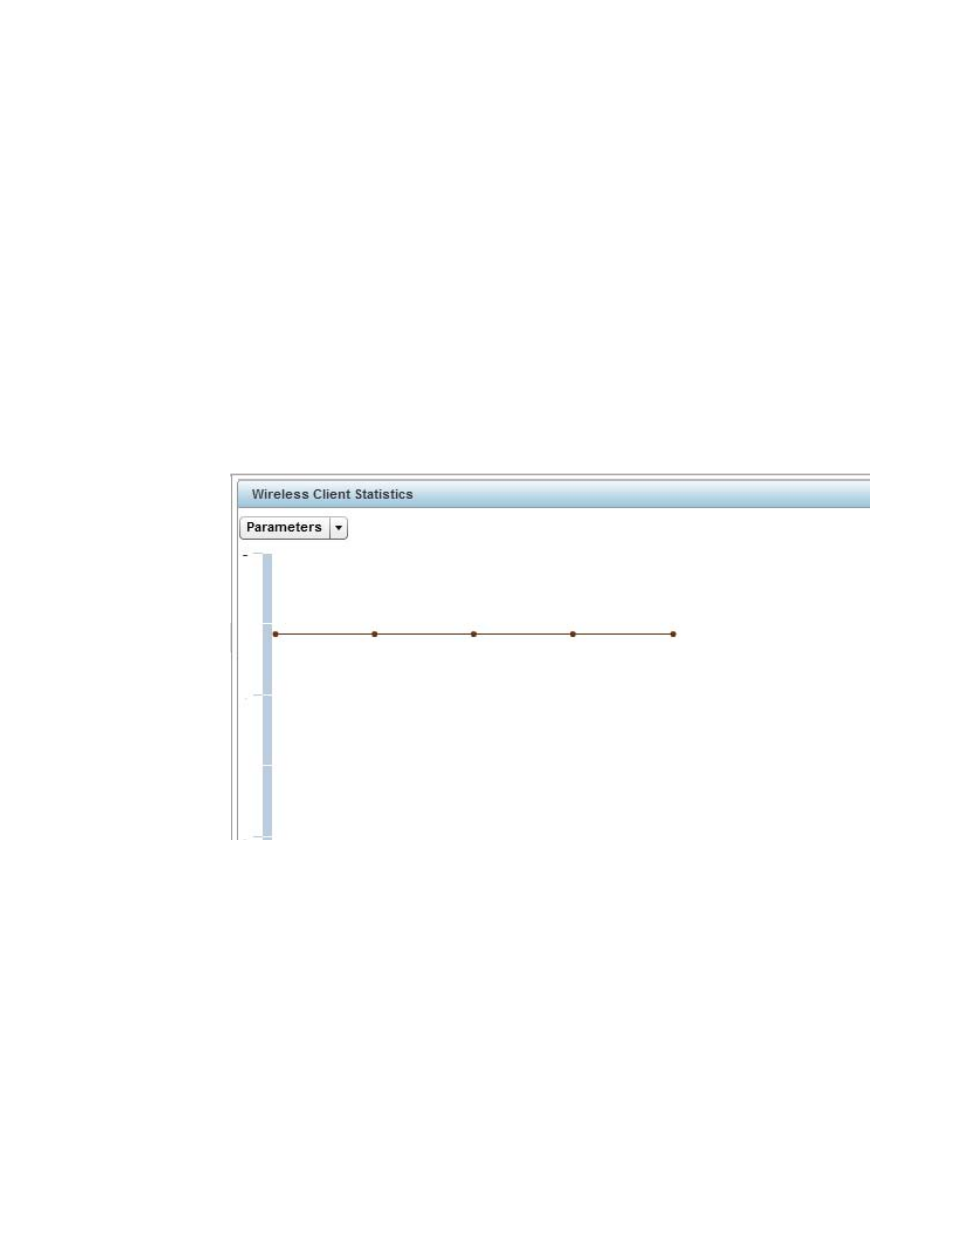
Use the client Graph to assess a connected client’s radio performance and diagnose performance
issues that may be negatively impacting performance. Up to three selected performance variables
can be charted at one time. The graph uses a Y-axis and a X-axis to associate selected parameters
with their performance measure.
To view a graph of this client’s statistics:
1. Select the Statistics menu from the Web UI.
2. Select System from the navigation pane (on the left-hand side of the screen). Expand a RF
Domain, select a controller or service platform, an Access Point then a connected client.
3. Select Graph.
4. Use the Parameters drop down menu to define from 1- 3 variables assessing client signal
noise, transmit or receive values.
5. Use the Polling Interval drop-down menu to define the interval the chart is updated. Options
include 30 seconds, 1 minute, 5 minutes, 20 minutes or 1 hour. 30 seconds is the default
value.
FIGURE 169
Wireless Client - Graph
Select an available point in the graph to list the selected performance parameter, and display that
parameter’s value and a time stamp of when it occurred.
Analytics Developer Interface
The analytics developer interface is an additional tool available to administrators to review specific
APIs in granular detail. The developer interface is available to elected NOC controllers or service
platforms capable of provisioning all of its peer controllers, service platforms and adopted devices.
NOC controllers include RFS9510, RFS6000 and RFS7000 models.
