Brocade Mobility RFS Controller System Reference Guide (Supporting software release 5.5.0.0 and later) User Manual
Page 1004
992
Brocade Mobility RFS Controller System Reference Guide
53-1003099-01
16
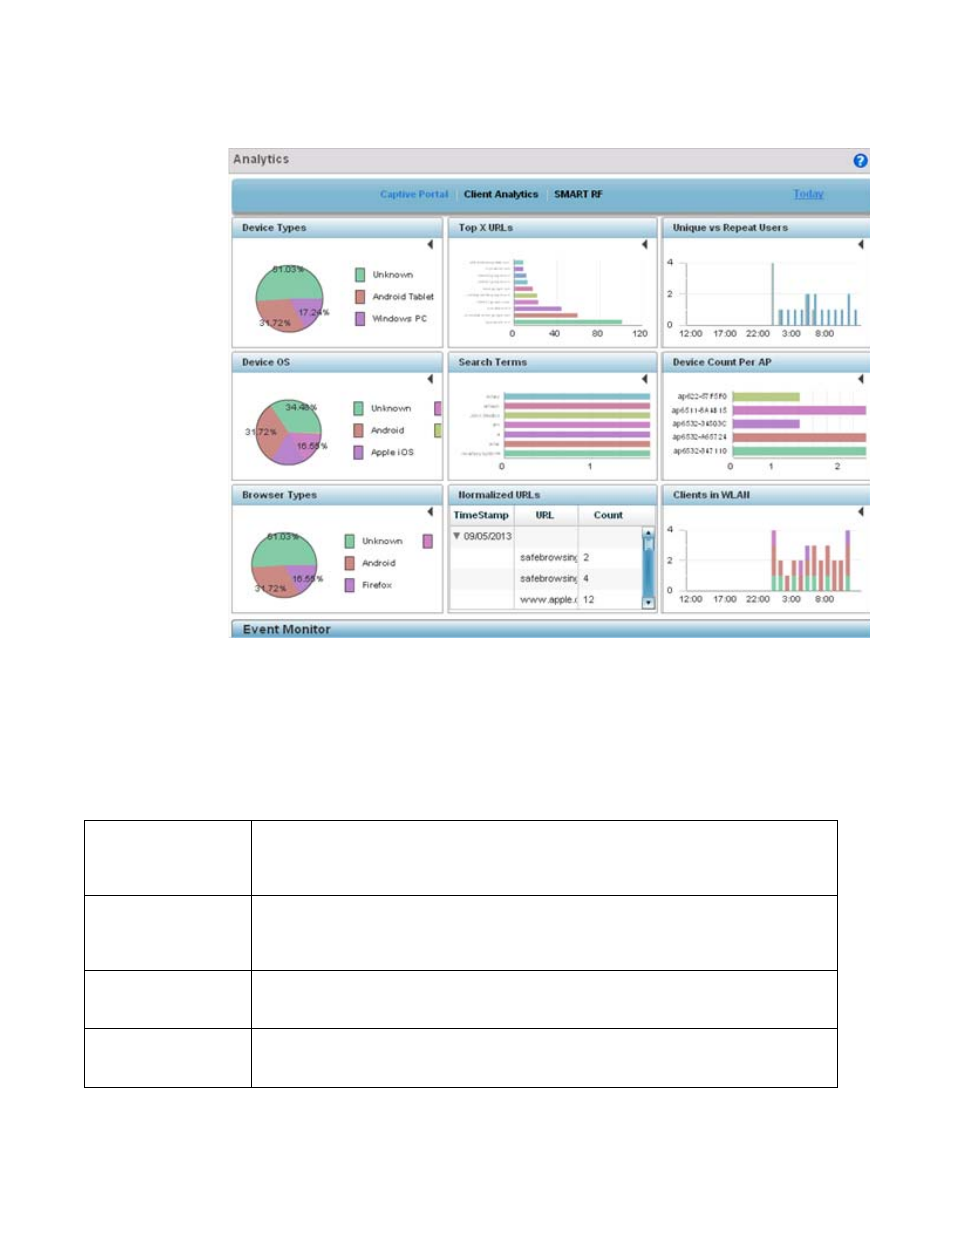
FIGURE 1
System Analytics - Captive Portal screen
3. Refer to the upper, right-hand, portion of the analytics interface and define the trending period
for the data displayed. Options include Last 1 Day, Last 3 Days, Last 1 Week, Last 2 Weeks,
Last 3 Weeks, Last 1 Month, Last 2 Months or Last 3 Months. Today is the default setting for
trending analytics data.
4. Refer to the following Captive Portal analytic data trended and reported in real-time on the
selected interval:
Device Types
Displays a pie chart (by default) of the captive portal clients (smart phones, tablets, laptops etc.). Select
the table icon from the top, right-hand, side of the field to display the data in table format. Both the pie
chart and table display the device type and the percentage of those devices only within the captive
portal.
Device OS
Displays a pie chart (by default) of connected devices (using captive portal authentication),
differentiated by their operating system (Windows, Linux, Android etc.). Select the table icon from the
top, right-hand, side of the field to display the data in table format. Both the pie chart and table display
the OS type and the percentage of that device OS type only within the captive portal.
Browser Types
Displays a pie chart (by default) of the browser types utilized by captive portal authenticated devices.
Select the table icon from the top, right-hand, side of the field to display the data in table format. Both
the pie chart and table display the OS type by percentage of utilization only within the captive portal.
Top X URLs
Reports the top visited URLs by connected clients using captive portal authentication. Use the spinner
control to refine the number of URLs reported, then select Reload to update the display. Set whether
the content is displayed as a chart or as a table.