Access point analytics – Brocade Mobility RFS Controller System Reference Guide (Supporting software release 5.5.0.0 and later) User Manual
Page 1014
1002
Brocade Mobility RFS Controller System Reference Guide
53-1003099-01
16
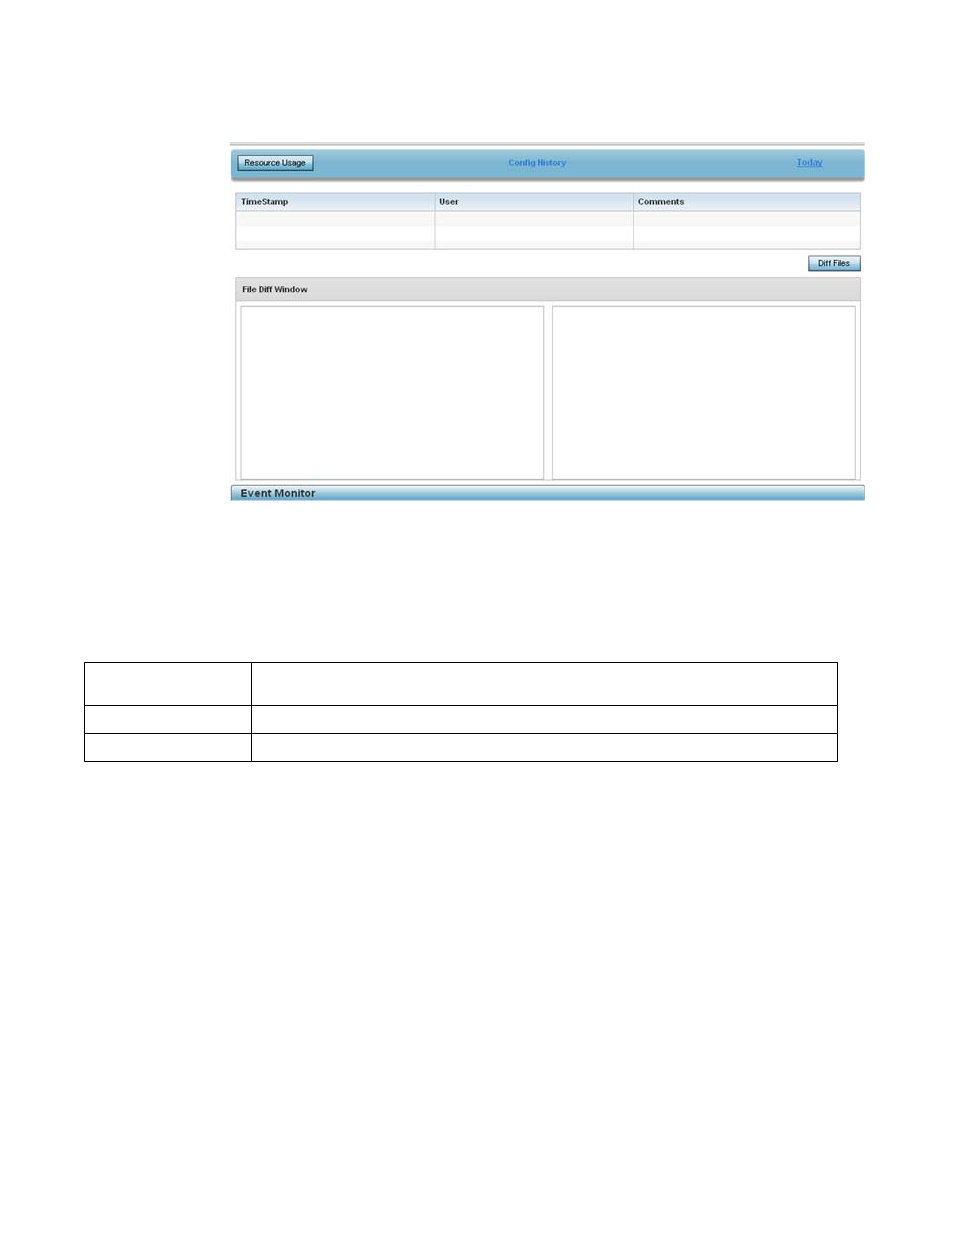
FIGURE 10
Wireless Controller Analytics screen
4. Optionally select the Resource Usage button to display a subscreen trending the service
platform’s RAM Usage (in MB) and Disk Usage (in GB). Periodically revisit the service platform’s
resource usage to assess whether resources are jeopardized at certain times of the day or
repeatable patterns are observable that can assist in administration.
5. Refer to the following analytic data trended for the selected controller or service platform:
6. Select the Diff Files button to display the updates made to the selected controller or service
platform’s configuration versus the previous configuration utilized.
Access Point Analytics
Refined analytics are available at the individual Access Point level of the user interface for trending
data for specific Access Points.
To review analytics for individual Access Points:
1. Select Statistics from the Web UI.
2. Select the Analytics menu item directly to the right of the System menu item within Statistics.
3. Expand the System hierarchy on the left-hand side of the user interface, expand a RF Domain
and select an member Access Point.
The Access Point analytics screen displays with Traffic tab displayed by default.
Timestamp
Displays a timestamp when an update was made to the selected controller or service platform’s
configuration.
User
Lists the user name initiating the controller update.
Comments
Lists any comments made relative to a configuration update.