Brocade Mobility RFS Controller System Reference Guide (Supporting software release 5.5.0.0 and later) User Manual
Page 980
968
Brocade Mobility RFS Controller System Reference Guide
53-1003099-01
15
Light intensity is measured by the sensor in lumens. The table displays the Current Light
Intensity (lumens) and a 20 Minute Average of Light Intensity (lumens). Compare these
two items to determine whether the deployment location remains consistently lit, as an
administrator can power off the Access Point’s radios when no activity is detected in the
immediate deployment area. For more information, see Setting a Profile’s Environmental
Sensor Configuration (BR1240 Only) on page 8-530.
5. Refer to the Light Intensity Trend Over Last Hour graph to assess the fluctuation in lighting over
the last hour. Use this graph to assess the deployment areas light intensity of particular hours
of the day as needed to conjunction with the daily graph immediately below it.
6. Refer to the Light Intensity Trend Over Last Day graph to assess whether lighting is consistent
across specific hours of the day. Use this information to help determine whether the BR1240
can be upgraded or powered off during specific hours of the day.
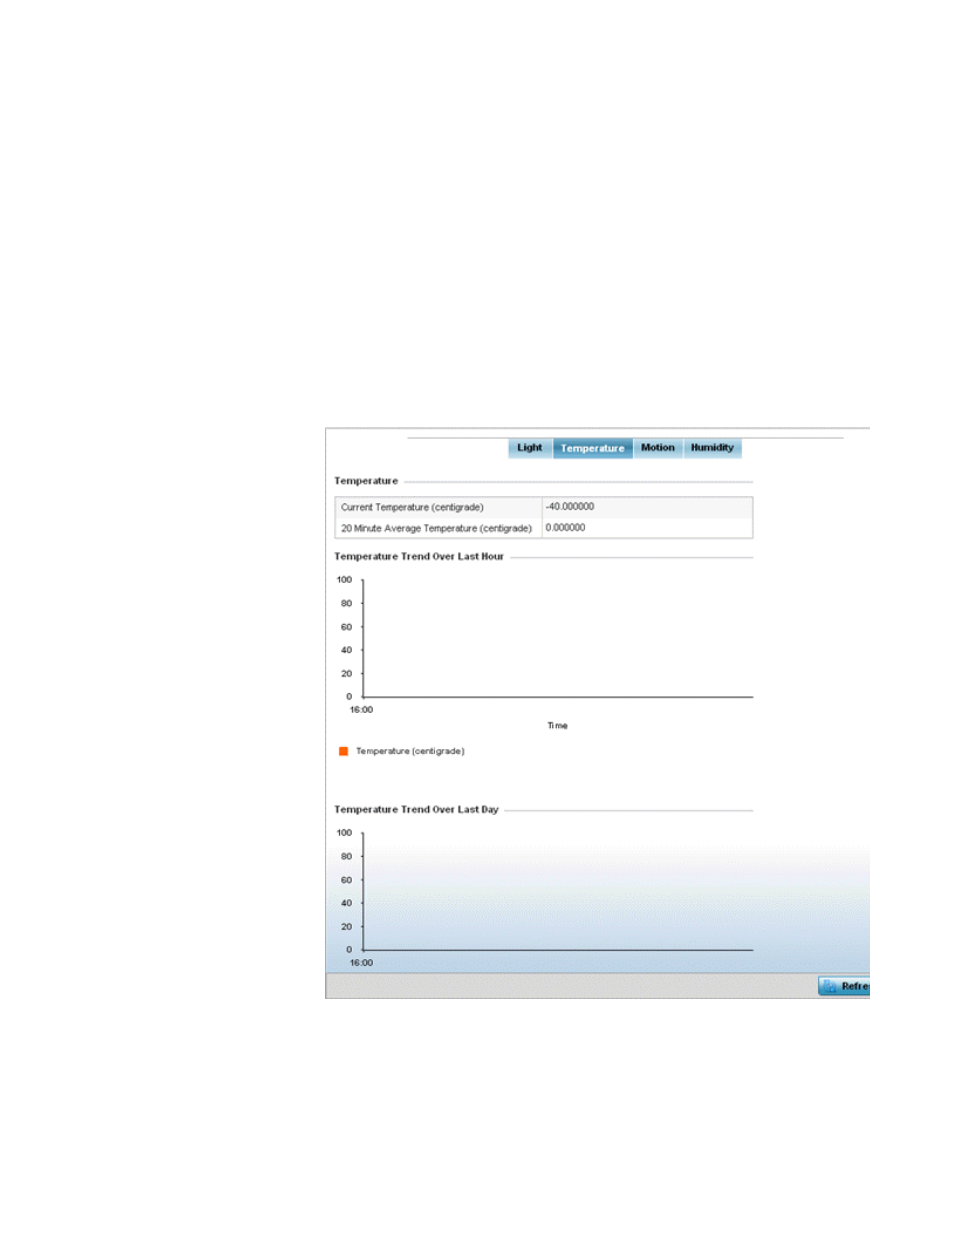
7. Select the Temperature tab.
FIGURE 161
Access Point - Environmental Sensor screen (Temperature tab)
8. Refer to the Temperature table to assess the sensor's detected temperature within the
BR1240’s immediate deployment area.