Mesh – Brocade Mobility RFS Controller System Reference Guide (Supporting software release 5.5.0.0 and later) User Manual
Page 825
Brocade Mobility RFS Controller System Reference Guide
813
53-1003099-01
15
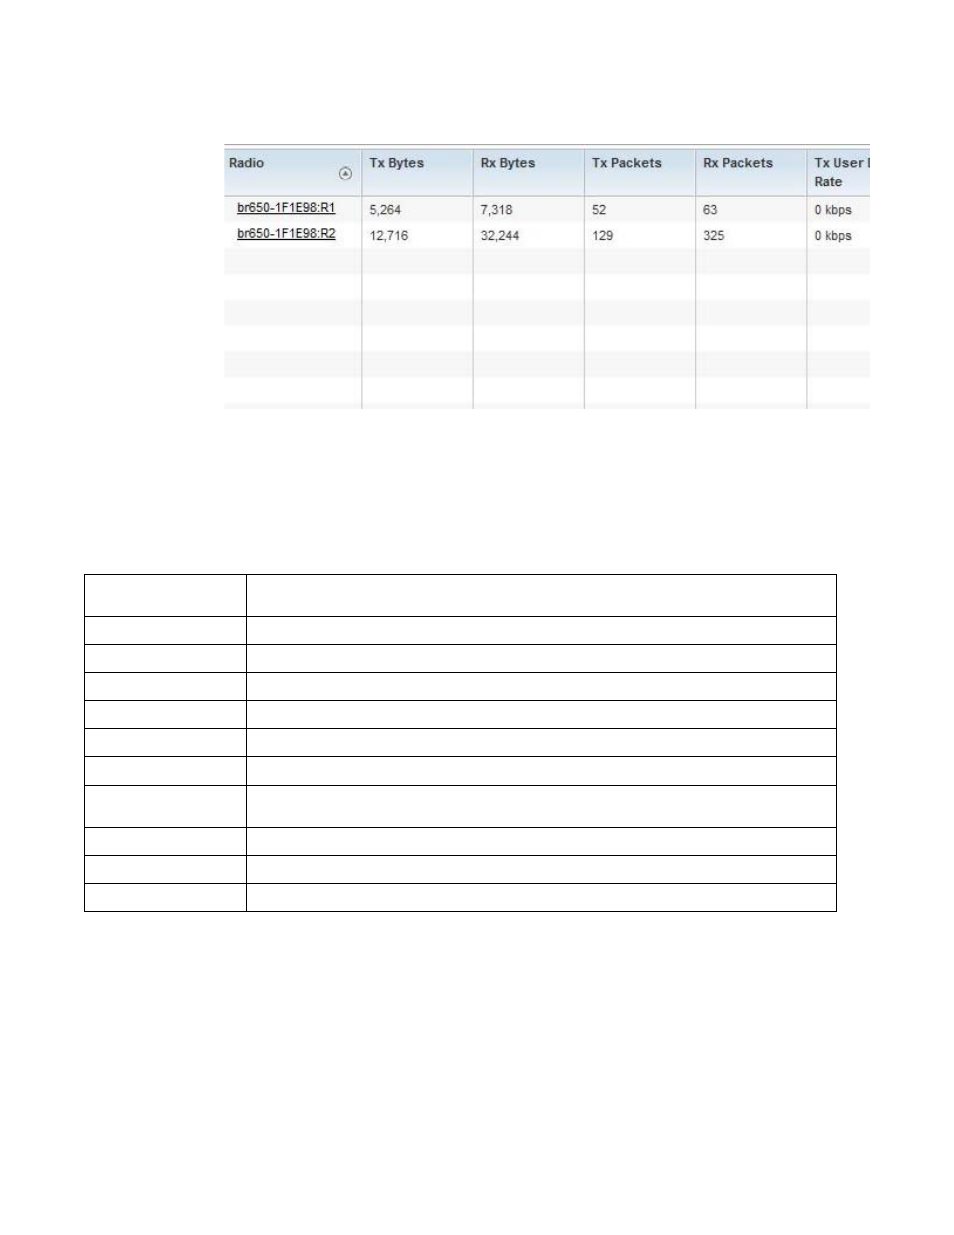
FIGURE 45
Wireless Controller - Radio Traffic Statistics screen
The Traffic Statistics screen provides the following information:
Mesh
The Mesh screen provides detailed statistics on each of Mesh capable client within the selected
controller or service platform’s radio coverage area.
To view Mesh statistics:
1. Select the Statistics menu from the Web UI.
Radio
Displays the name assigned to each listed radio. Each radio name displays as a link that can be selected
to display radio configuration and network address information in greater detail.
Tx Bytes
Displays the amount of transmitted data in bytes for each radio.
Rx Bytes
Displays the amount of received data in bytes for each radio.
Tx Packets
Displays the amount of transmitted data in packets for each radio.
Rx Packets
Displays the amount of received data in packets for each radio.
Tx User Data Rate
Displays the average speed in kbps of data transmitted to users for each radio.
Rx User Data Rate
Displays the average speed (in kbps of data) received from users for each radio.
Tx Dropped
Displays the number of transmissions (packets) dropped by each listed radio. An excessive number of
drops and a high error rate could be an indicator to lighten the radio’s current load.
Rx Errors
Displays the total number of receive errors for each radio.
Error Rate
Displays the total error rate (in all directions) for each radio.
Refresh
Select Refresh to update the statistics counters to their latest values.