Brocade Mobility RFS Controller System Reference Guide (Supporting software release 5.5.0.0 and later) User Manual
Page 1005
Brocade Mobility RFS Controller System Reference Guide
993
53-1003099-01
16
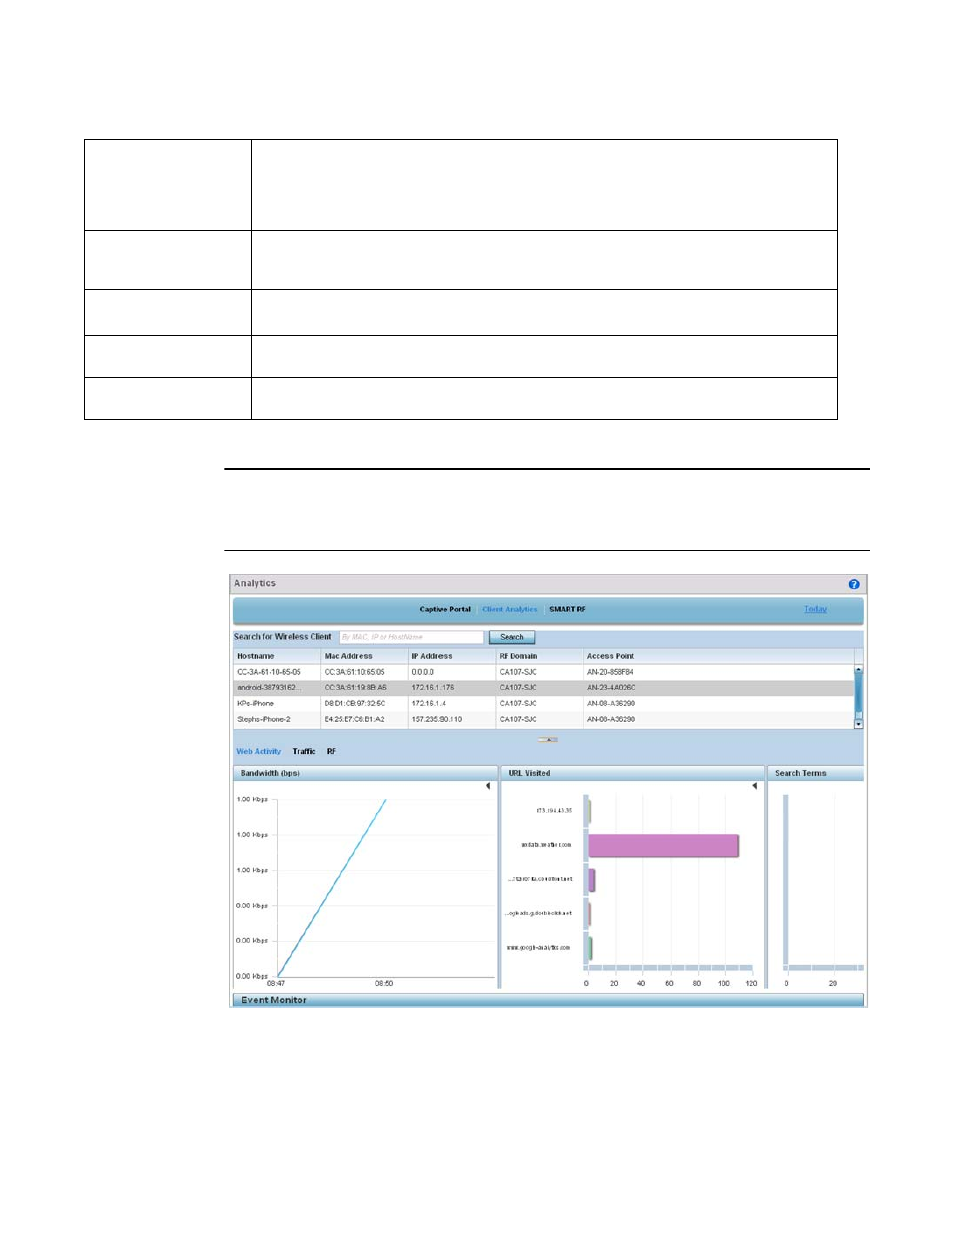
5. Select Client Analytics to display analytic level data for connected wireless clients.
NOTE
Be sure to select the Search button adjacent to the Search for Wireless Client parameter to ensure
the tables are populated and refreshed with detected wireless clients. Client analytics are trended
every 75 minutes.
FIGURE 2
System Analytics - Client Analytics screen
Search Terms
Lists the number of unique clients who searched for using a search term. Each display option lists the
search term and the number of times each term was searched by a connected captive portal client. For
example, if there’s two clients (clients A and B), and client A searched for "brocade" 5 times and B
searched for "brocade" 2 times. The count would be 2 and not 7. As with URLs, search terms are
normalized (aggregated daily).
Normalized URLs
Reports URLs visited most often, normalized (aggregated daily), by devices using captive portal
authentication. Select the arrow to the left of each listed URL timestamp to populate the URL and Count
columns with the specific URLs visited and the number of times they’ve been visited.
Unique vs Repeat
Users
Displays a breakdown of repeat versus new users to the captive portal. Both a chart and a table display
are available, each with a timestamp of when the data was collected.
Device Count Per AP
Displays the number of top performing Access Points reporting connected client counts using captive
portal authentication.
Clients in WLAN
Displays the number of managed WLANs reporting connected client counts. Client analytics are trended
every 75 minutes.