Brocade Mobility RFS Controller System Reference Guide (Supporting software release 5.5.0.0 and later) User Manual
Page 990

978
Brocade Mobility RFS Controller System Reference Guide
53-1003099-01
15
2. Select System from the navigation pane (on the left-hand side of the screen). Expand a RF
Domain, select a controller or service platform, an Access Point, then a connected client.
3. Select Traffic.
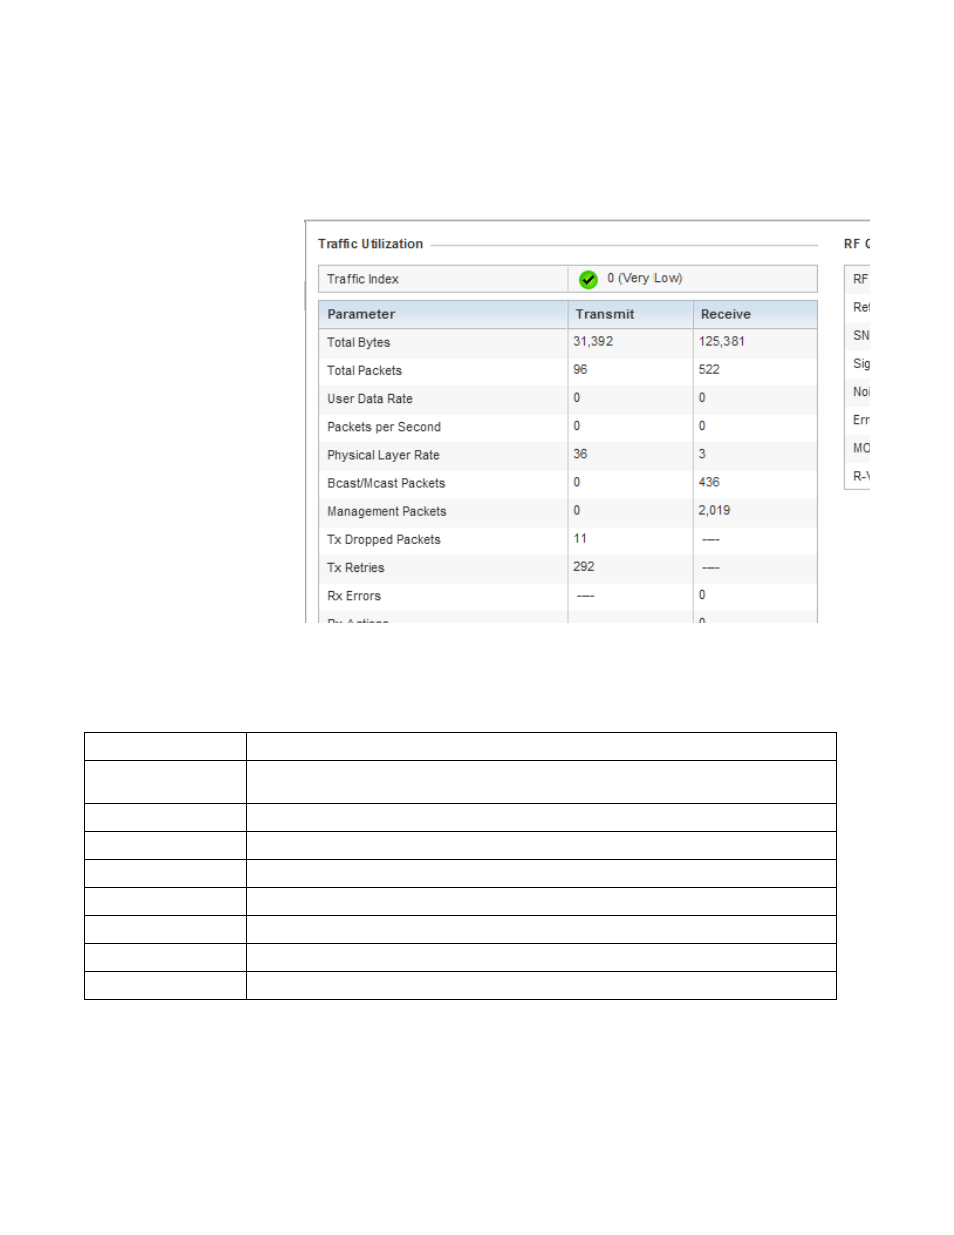
FIGURE 166
Wireless Client - Traffic screen
Traffic Utilization statistics employ an index, which measures how efficiently the traffic medium is
used. It’s defined as the percentage of current throughput relative to the maximum possible
throughput. This screen also provides the following:
Total Bytes
Displays the total bytes processed (in both directions) by the Access Point’s connected client.
Total Packets
Displays the total number of data packets processed (in both directions) by the Access Point’s
connected wireless client.
User Data Rate
Displays the average user data rate.
Packets per Second
Displays the packets processed per second.
Physical Layer Rate
Displays the data rate at the physical layer level.
Bcast/Mcast Packets
Displays the total number of broadcast/multicast packets processed by the client.
Management Packets
Displays the number of management (overhead) packets processed by the client.
Tx Dropped Packets
Displays the client’s number of dropped packets while transmitting to its connected Access Point.
Tx Retries
Displays the total number of client transmit retries with its connected Access Point.
