Standard charts, Setup and view a trend – Rockwell Automation Energy Management Accelerator Toolkit Quick Start User Manual
Page 194
194
Rockwell Automation Publication IASIMP-QS016C-EN-P - October 2014
Chapter 9 FactoryTalk EnergyMetrix Software Reports and Charts
Standard Charts
Two standard charting tools are available to view and analyze energy usage and demand.
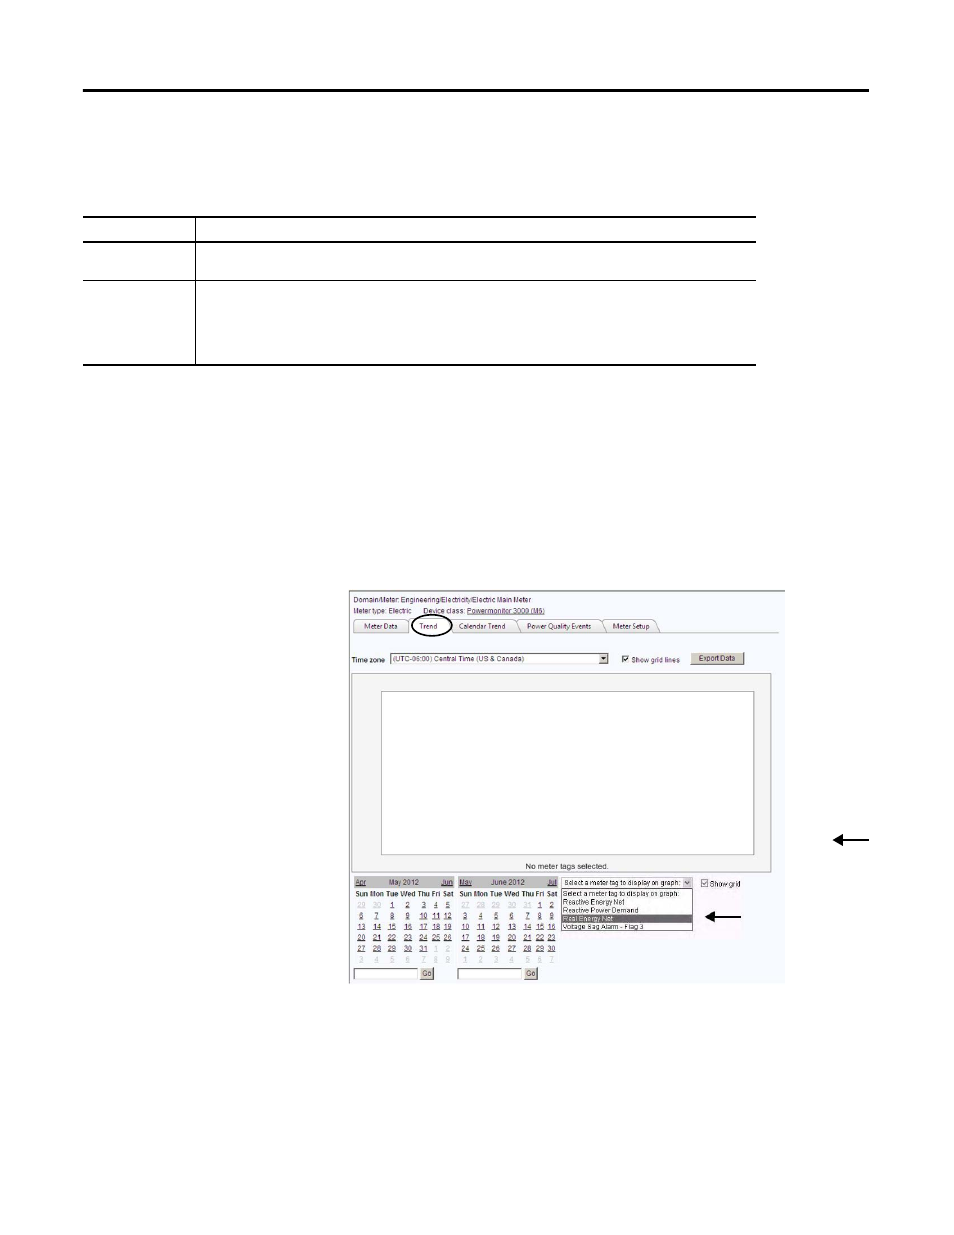
Setup and View a Trend
1.
Click the Meters tab.
2.
Navigate to and select the group and meter for the trend.
For this example, select the Electric Main Meter under the Electricity group in the Engineering subdomain.
3.
Click the Trend tab.
A blank chart appears and
is labeled No meter tags
selected.
4.
Select a time zone for the
chart.
The default is the logged-in
user time zone.
5.
Choose a meter tag to
display from the list.
Chart Type
Description
Trend
Displays a trend of one or more logged parameters from one or more meters over a specified time interval.
You can select up to five parameters on the same chart.
Calendar
Displays a trend line of one logged parameter in a calendar format.
This chart is typically used to display real or reactive power demand over time to pinpoint peaks that vary by
day, week or month. You can zoom in on a day's chart by clicking on the day in the calendar view. Selecting
multiple days overlays one trend line on top of another, allowing you to compare, for instance, all Mondays in
a month.
TIP
In addition to the standard charts, the optional ChartsPlus package extends custom charting capabilities. This client
application downloads and runs on the client computer.