Echelon SmartServer 2.2 User Manual
Page 434
SmartServer
2.2 User’s Guide
435
Status
Displays the current status of the data point.
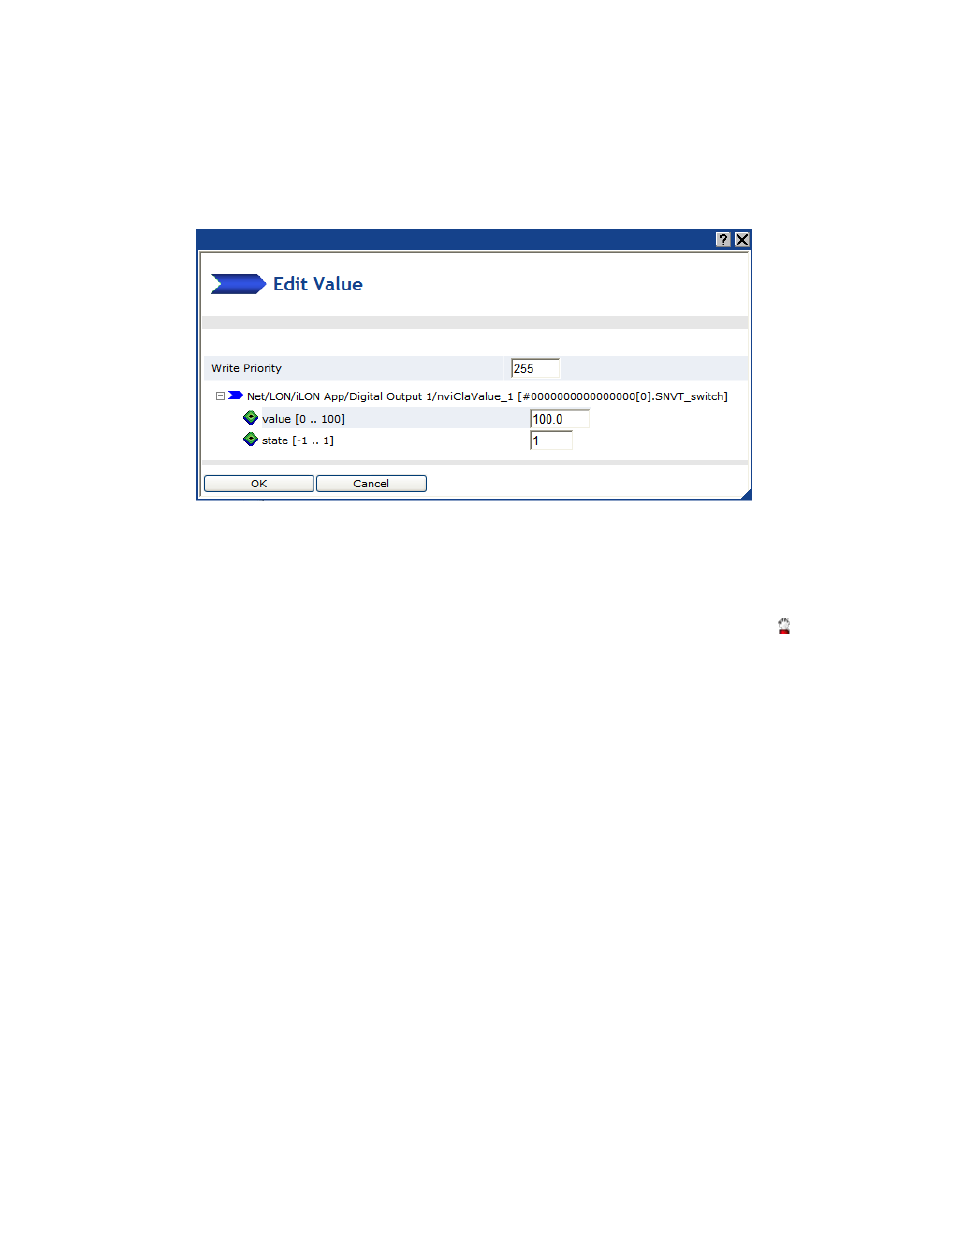
5. You can click the button to the right of the Values property to open the Edit Value dialog. You
can use this dialog to assign the View - Data Points Web page a different priority for writing
updated values to a data point, and to enter a different value for the data point or for the fields of a
structured data point.
a. In the Write Priority box, you can assign the priority the View - Data Points Web page has
for writing updated values to the data point. The priority you specify must be equal to or
higher than the priority used by the last application that updated the data point. Similarly, if
you update the data point with the View - Data Points Web page, the next application must
specify a priority equal to or higher than the one you specified in order to write to the data
point. If you set a priority that is less than priority used by the last application that updated
the data point, a “Priority too low to set value” error occurs and a red hand locked icon (
)
appears to the left of the data point. You need to enter a higher priority in this dialog for the
View - Data Points Web page to be able to write to the data point.
b. In the Value box, enter a valid value to be written to the data point. If you selected a
structured data point (for example, a SNVT_switch data point), you can enter values for one
or more of the fields in the data point. If you selected an enumerated data point (for example,
a SNVT_lev_disc data point), select one of the enumerated values from the list.
c. Click OK to return to the View – Data Points Web page.
6. You can point to one of the listed data points in the log or click its line on the trend graph to
highlight the updates recorded for that data point on the trend graph. You can then move the
mouse pointer over one of the plotted data point updates to show a ToolTip. The ToolTip lists the
date and time of the update and the value and state of the data point at the time the update was
recorded.
7. You can use the slide bar at the top to browse the first to last updates recorded for the selected data
point. Move the slider bar to the left to display older sets of values, or move it to the right to
display the more recent values. If there are too many values within the selected range to be
displayed, a warning message appears informing you that only a subset of the data points is being
displayed.
8. You can specify the time interval for which recorded data point updates are listed in the log and
displayed in the trend graph using the drop-down list directly below the slider. The default is
Entire Range, which means that the log lists the first to last data point updates recorded in the
data loggers on the SmartServer and the trend graph plots the first to last updates recorded for a
selected data point.