Echelon SmartServer 2.2 User Manual
Page 187
188
Using the SmartServer Web Interface
2. The SmartServer gets all the Web connections on the subject network, channel, device, or
functional block. This process may take a few minutes depending on the number of Web
connections being collected.
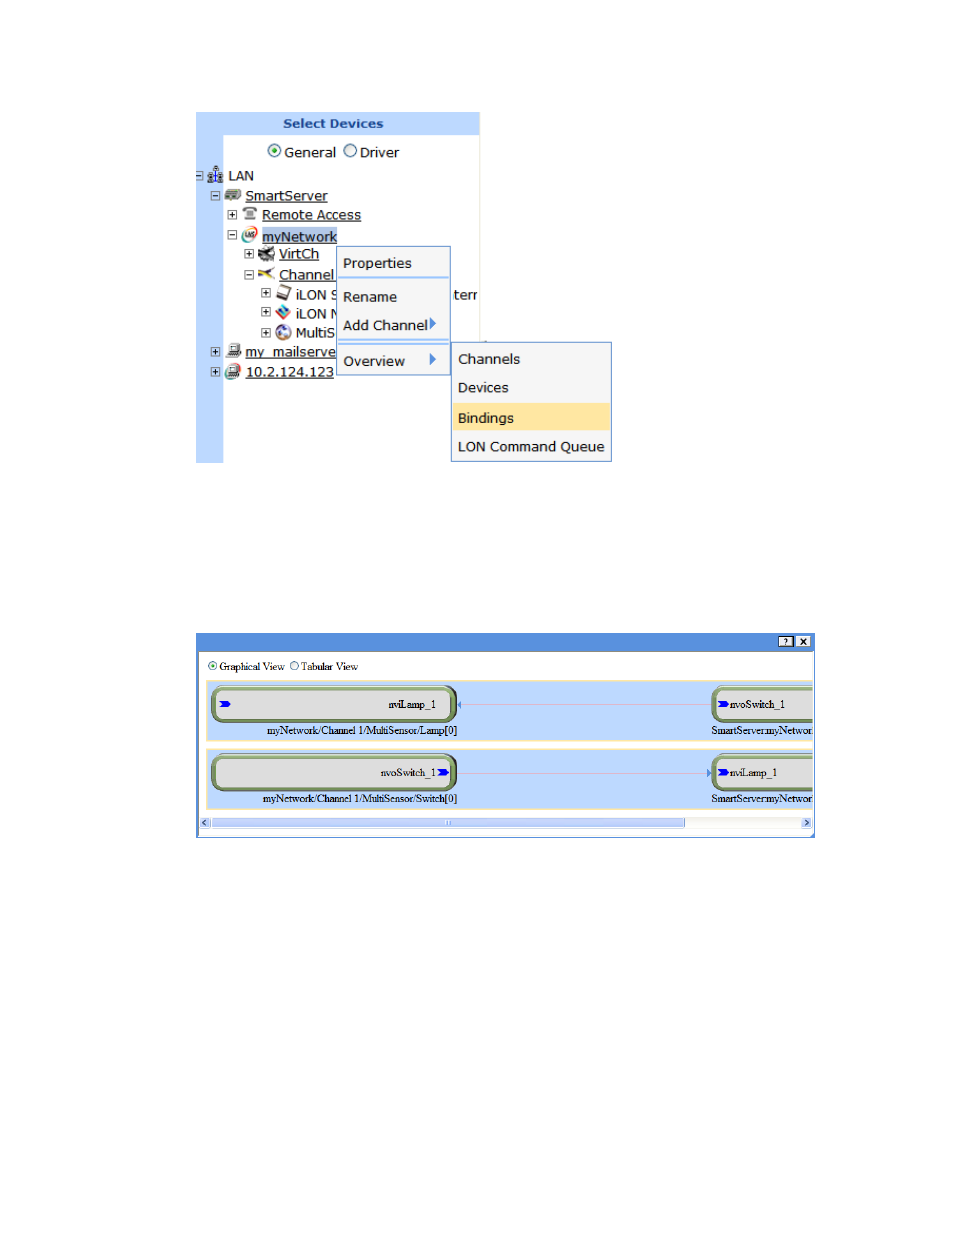
3. A dialog opens graphically displaying all the functional blocks containing connected data points
on the subject network, channel, device, or functional block. The functional blocks containing the
source data points in the connections are displayed on the left side, and the functional blocks
containing the target data points are displayed on the right. Multiple connections within single
functional blocks are represented with different colors.
4. Select Graphical View to graphically display all the functional blocks containing connected data
points. The functional blocks containing the source data points in the connections are displayed
on the left side, and the functional blocks containing the target data points are displayed on the
right. Multiple connections within single functional blocks are represented with different colors.
You can click a data point in this view to select it in the navigation pane on the left side of the
SmartServer Web interface (provided that it is currently displayed in the navigation pane).
5. Select Tabular View to list all the connected source and target data points in a table. You can
click a network variable to select it in the navigation pane (provided that it is currently displayed
in the navigation pane).