Data source, Pens, Data source -3 pens -3 – Rockwell Automation 9301 Series RSView32 Users Guide User Manual
Page 474
Configuring trends
13–3
Data source
The data displayed in a trend can come from two sources. For real-
time trends, data comes from the value table as it is collected. For
historical trends, data comes from a data log model’s set of files.
Historical trends can also be set up to display data from a single log
file at a time. This is called file–based trending, and is useful if you
want to display data from a particular shift or batch process.
For historical trends you can display data from a data log model in the
project you are running, or you can display data from a different
project, either on the same computer or on another computer on the
network. Displaying data from a different project is called remote
trending.
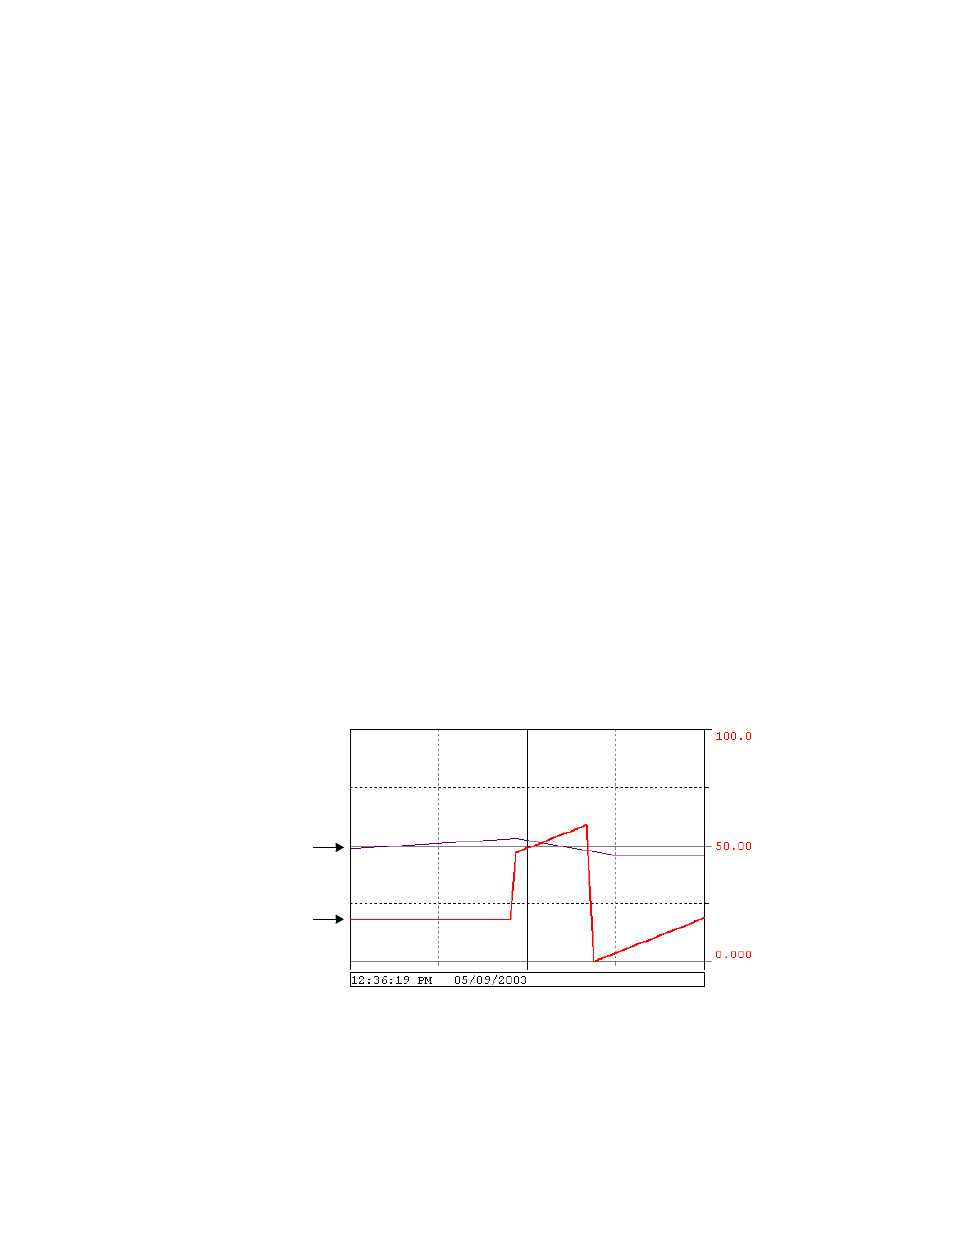
Pens
Pens are the lines and/or symbols used to represent values. The values
can be tags you are monitoring or they can be constant values. To
show a tag value, specify a tag name. To show a constant value—such
as a tag’s alarm levels—specify a value instead of a tag name. To define
the pen’s tag at runtime, use a tag placeholder. For details, see
“Configuring pen style” on page 13-19.
Both of these lines are
pens. Pens can use
different colors, widths,
and symbols so
operators can easily
distinguish one pen from
another.