L-force | plc designer – Lenze PLC Designer PLC Designer (R3-1) User Manual
Page 791
L-force | PLC Designer
General Editors
DMS 4.1 EN 03/2011 TD29
789
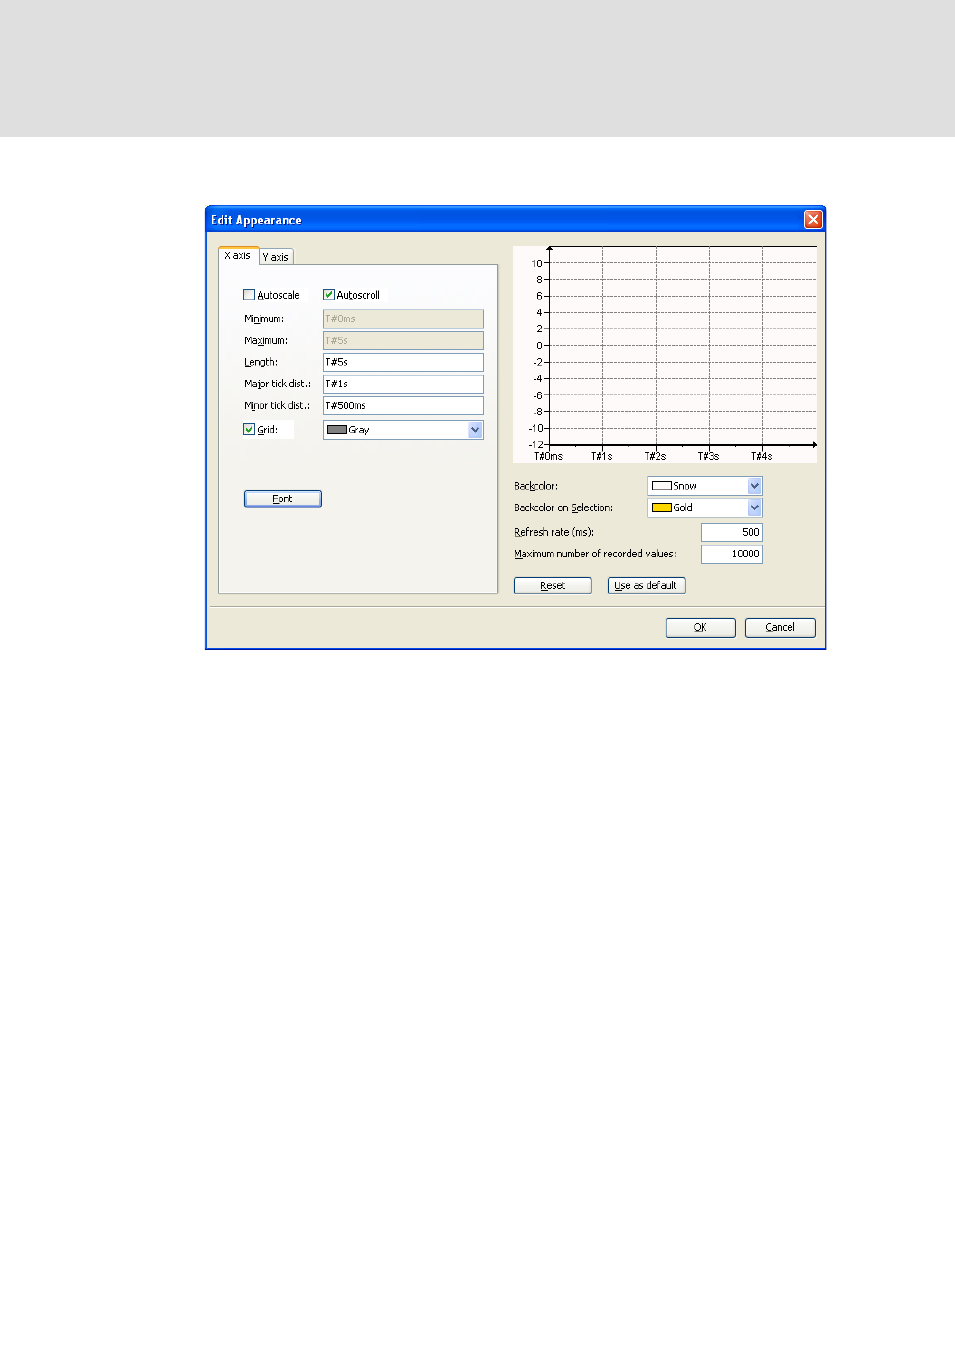
The following settings are done for the X axis and the Y axis of the trace graph and
they are visible when the trace diagram is displayed in single channel view.
Abb. 432 Edit Appearance dialog
Autoscale: If this option is activated, the time span for tracing, that is the time span
displayed on the x-axis of the trace window, will automatically be scaled according to
the buffer size currently defined for the record in the runtime system.
If the option is not activated, the time span which is displayed in the trace window, can
be defined by the following settings:
If option Autoscroll is not activated:
Minimum , Maximum : The times entered here (standard time format, for example
"T#200s") define exactly the time span of the tracing to be displayed. This means, that
the x-axis starts with the Minimum time and ends with the Maximum time. If another
time span should be displayed, you have to scroll manually.
If option Autoscroll is activated (only possible, if option 'Autoscale' is not activated):
Length: The time span given here (standard time format, for example "T#2m") will be
displayed, whereby the axis will be scrolled in a way that automatically the most
recent variable values will be visible.
Major tick dist.: Value intervals indicated on the axis by long ticks. If Grid is activated
they will be elongated by dotted lines. The entry must match the value type
represented by the axis and must follow the IEC syntax; for example a time value for
the x-axis: for example "T#2s" for 2 seconds.
Minor tick dist.: Value intervals indicated on the axis by short ticks (not elongated by a
vertical dotted line in case Grid is active). Valid entries see 'Major tick dist.".