Viewing data from the data logger – Maple Systems MAPware-7000 User Manual
Page 249
MAPware-7000 Programming Manual
249
1010-1040, Rev. 02
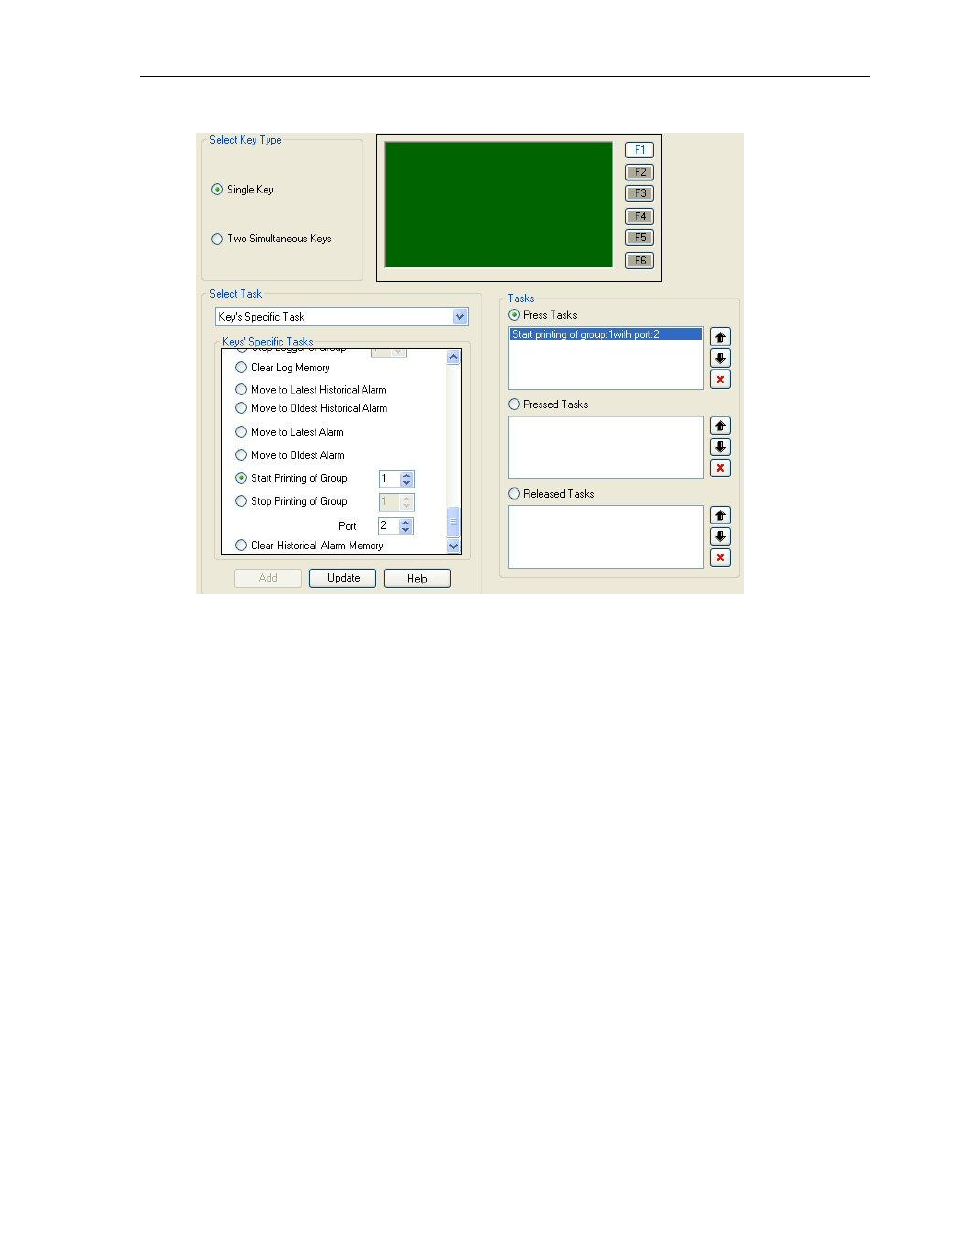
Click single key option, then highlight the Function key (F1, F2 …) that you wish to use.
Under Tasks, click Press Tasks.
From the Select Task menu, select Key’s Specific Task.
Click on Start or Stop Printing of Group. Enter the Group # (1-4).
Under Port #, enter the com port that the serial printer is attached to (Com1 or Com2).
Click the Add button. Should appear in the Press Tasks section as shown above.
Click the OK button (for Multi-Task buttons).
Viewing Data from the Data Logger
There are currently three methods that you can use to see the data collected by the Data Logger
for each group configured:
Historical Trend Graph- this method records values read from the Data Logger over the
specified date/time. It then displays the data as a line graph. A maximum of four data
points (channels) are represented on each graph. The Historical Trend Graph is the only
option available to see data from the Data Logger on the HMC7000 unit.
Upload to a USB Flash drive- this method allows you to capture data in a CSV (Comma-
Separated-Value) format as a data table which is stored on an attached USB Flash Drive
to the HMC7000.
Upload to the MAPware-7000 software- this method allows you to upload the collected
data directly into the MAPware-7000 configuration software as a CSV file. This CSV file
can then be viewed using the Tools…Display Logged Data option from the standard
menu.