Maple Systems MAPware-7000 User Manual
Page 179
MAPware-7000 Programming Manual
179
1010-1040, Rev. 02
Place a Bar Graph object on screen
1. Use one of the following:
a. click Draw…Display Objects…Bar Graph from the standard menu
b. click Advanced Objects…Bar Graph from the Draw toolbar
c. click on the Bar Graph icon in the Objects toolbar
2. Move
cursor to a start point for the bar graph object. Click and hold mouse cursor.
3. Drag mouse cursor to an end point for the bar graph object and release. The object appears
on screen and the Bar Graph Properties box displays.
Bar Graph Properties Options
Color Animation (see Feature List A) – dynamically change the color of the object
Visibility Animation (List C) – make the object disappear or become ‘invisible’
Fill Color – select the color that represents relative value in target register
Line Color (List E) – sets color of the perimeter line
Pattern – this is an option to use two colors for the fill color. The pattern determines
how the two colors show. Eight patterns are available. Click
to display the pattern
options.
Pattern Color – Select the second fill color when using the pattern option above. Click
to display the color palette.
Design (List S) – identifies object
Graph Operation – settings for the graph object
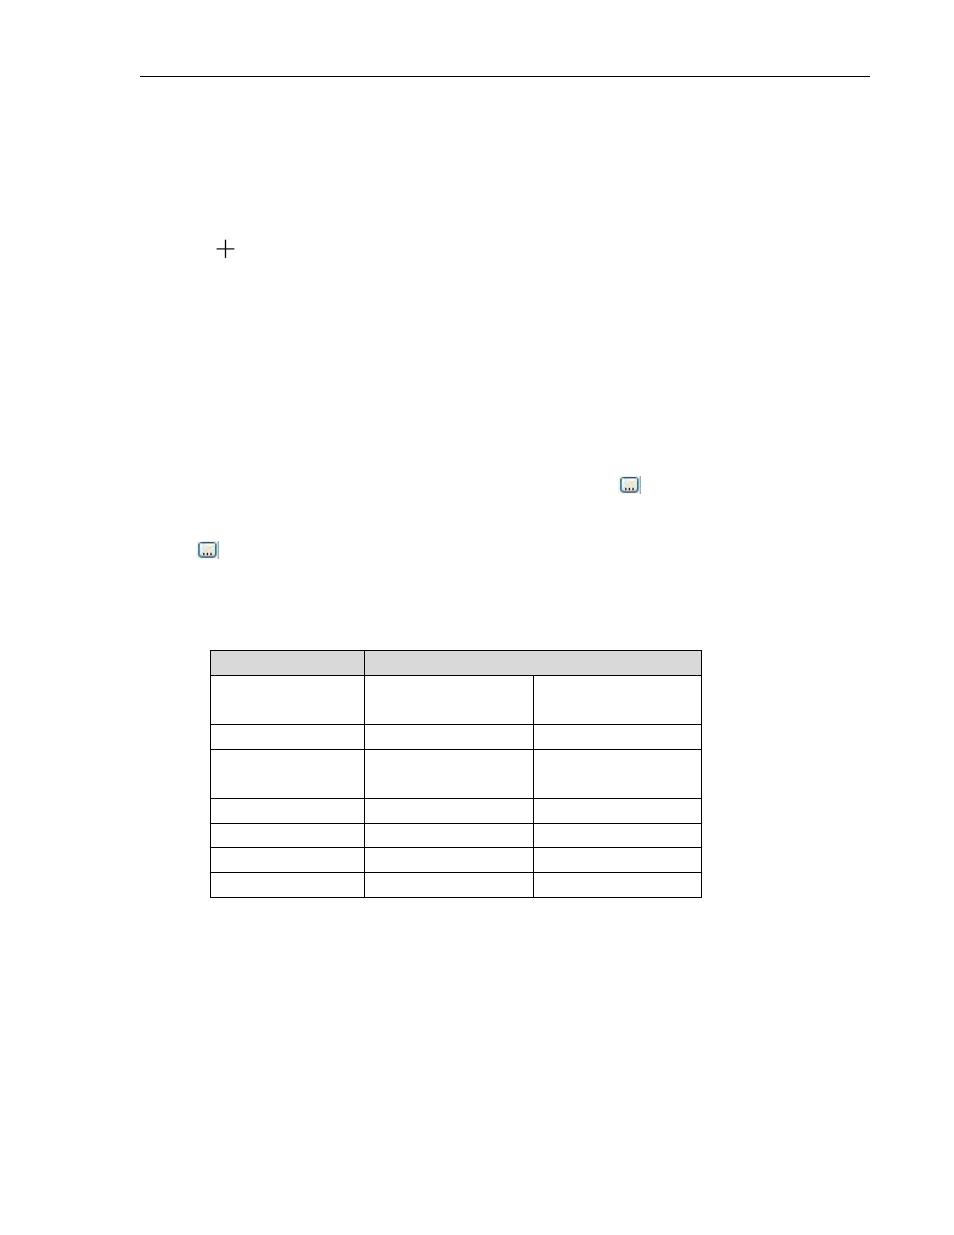
Data Type – options are:
Data Type
Range
Target Address
(2 bytes)
Target Address
(4 bytes)
Unsigned
0 to 65535
0 to 4294967295
Signed
-32768 to 32767
-2147483648 to
2147483647
Hexadecimal
0000 to FFFF
0000 to FFFFFFFF
BCD
1
0 to 9999
0 to 99999999
Binary
16 bits
16 bits
Floating Point
2
NA
Maximum of 9 digits
1- If the value in the monitored target register is not a valid BCD number, a dollar sign ‘$’ is
displayed.
2- Floating Point format is based upon the IEEE 754 standard for 32-bit single precision
numbers. A maximum of nine digits is supported. Values are rounded to the nearest decimal
point (ex: if Format: Digits after Decimal Point is set to 1 digit, then floating point number
1.52 would be displayed as 1.5 and 1.56 would be displayed as 1.6).
Direction – determines in which direction the graph moves as it tracks the target value.
Options are Left to Right, Right to Left, Bottom to Top, and Top to Bottom.
Maximum/Minimum Value (List Pe) – select the limits the bar graph uses to determine
the relative level of the graph. The maximum value is a completely filled bar graph. The
minimum value is a bar graph with no fill color shown.