Maple Systems MAPware-7000 User Manual
Page 190
190
MAPware-7000 Programming Manual
1010-1040, Rev. 02
3. Drag mouse cursor to an end point for the Historical Trend Graph object and release. The
object appears on screen and the Historical Trend Properties box displays.
4. Note: Before you can place a historical trend graph on the screen, you must first configure
the Data Logger (see Chapter 8 – DataLogger and Trending)
Historical Trend Properties Options
Appearance section – these attributes determine the general look of the historical trend
graph.
Background Color – determines the fill or background color of the historical trend graph.
Click on the
button to display the color palette and select a color.
Error Message Font Color – determines the color of any error messages that may appear
during the execution of the historical trend graph. Click on the
button to display the
color palette and select a color.
Font – used to configure the pixel size (WxH) of the error message. Options are 5x7 and
7x14 pixels. Note: error messages that do appear display along the bottom of the trend
graph.
Grid – option to display gridlines on the historical trend graph
Grid Color – determines the color of the gridlines. Click on the
button to display the
color palette and select a color.
Label – option to have a text label appear on the top of the historical trend.
o Label Font – determines the font type, size, etc.
Name- Type font used
Size- select font size
Bold- select ‘True’ to enable
Italic- select ‘True’ to enable
Underline- select ‘True’ to enable
o Label Text – enter the text to appear in the label
o Label Text Color – determines the text color of the label. Click on the
button
to display the color palette and select a color.
Language – highlight the language that must be selected to display the entered text
Design (List S) – identifies object
Layout (List T) – coordinates (i.e. size and position) for the object
Tag Attributes section – use this section to configure the number of trend lines (target
tag addresses) and colors.
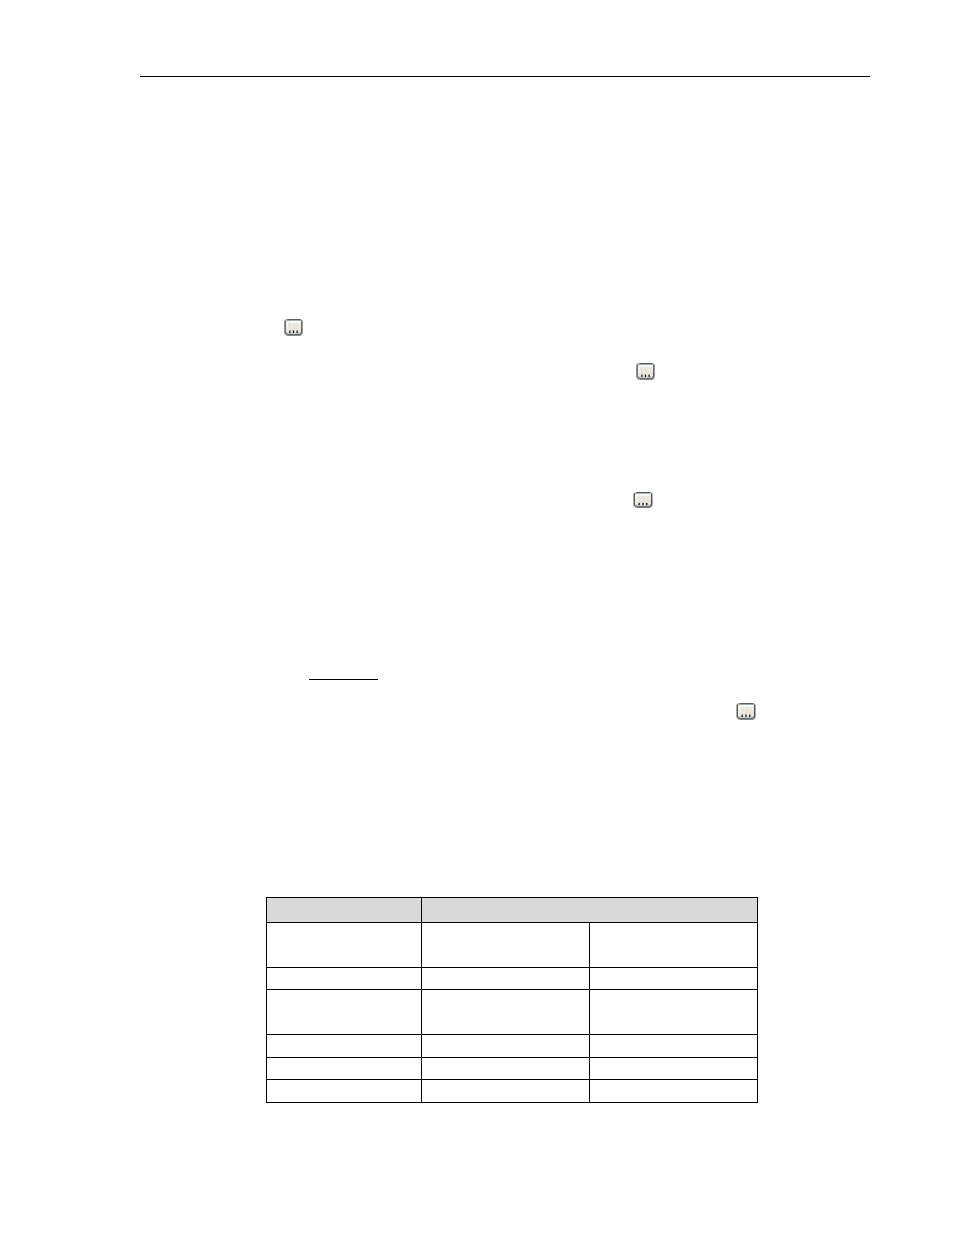
Data Type – options are
Data Type
Range
Target Address
(2 bytes)
Target Address
(4 bytes)
Unsigned
0 to 65535
0 to 4294967295
Signed
-32768 to 32767
-2147483648 to
2147483647
Hexadecimal
0000 to FFFF
0000 to FFFFFFFF
BCD
1
0 to 9999
0 to 99999999
Floating Point
2
NA
Maximum of 9 digits