Chapter 3. viewing and editing images – Bio-Rad Quantity One 1-D Analysis Software User Manual
Page 72
Chapter 3. Viewing and Editing Images
3-21
You can also type specific High and Low values in the text boxes next to the sliders.
Click anywhere on the slider bars to move the sliders incrementally.
Log High/Low Sliders changes the feedback from the slider handles, so that when
you drag them, the slider markers move a shorter distance in the histogram. This
allows for finer adjustments when the data is in a narrow range.
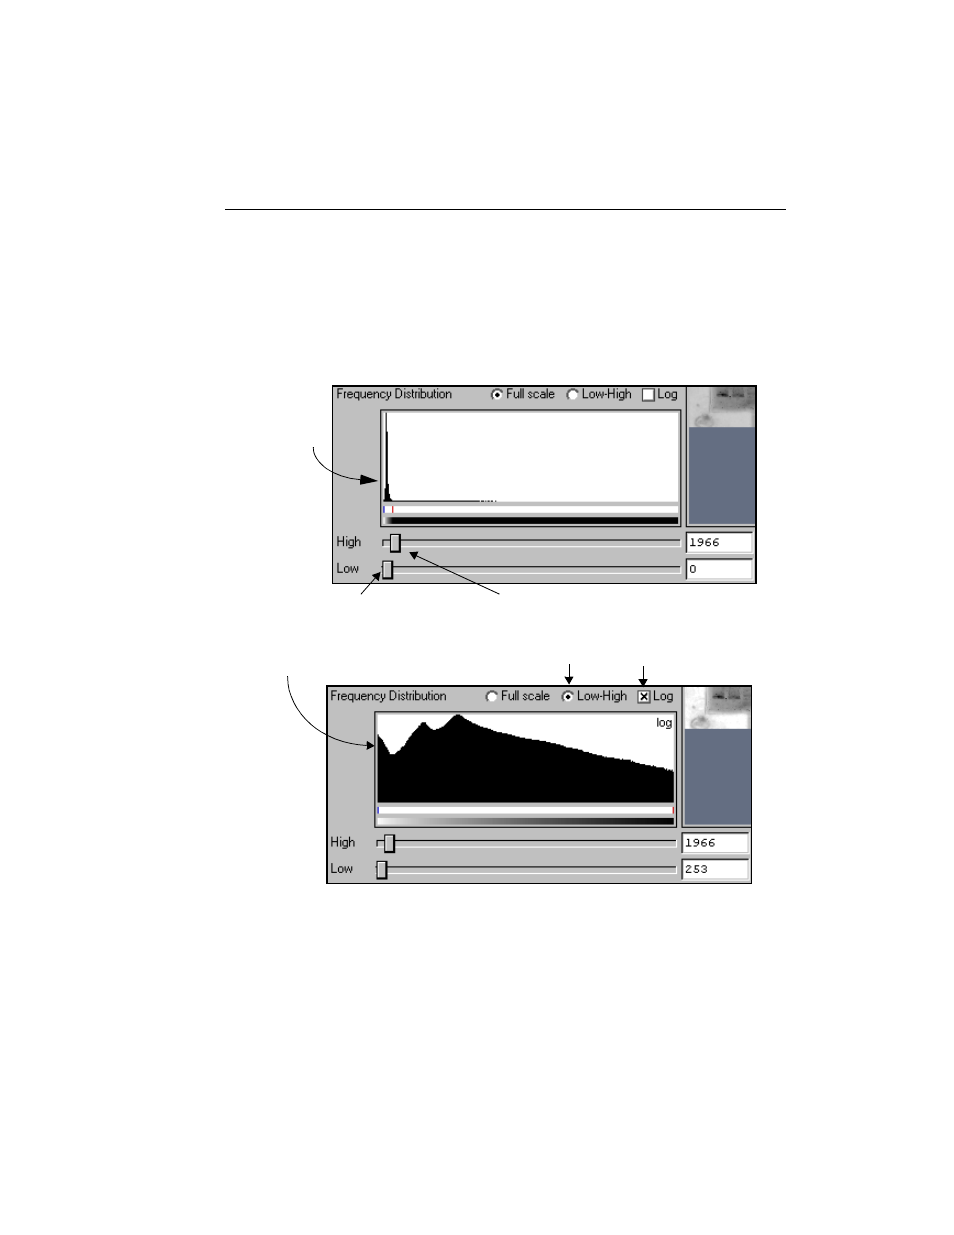
Fig. 3-15. Two views of the Frequency Distribution histogram.
Low-High magnifies
area between sliders
Can better distinguish background
noise from real data
Low slider remaps background noise to white
High slider remaps weaker signals to black
the range of
data in the image
is very limited
Log scaling enables you to
better distinguish peaks
In this example,