3 compare lanes, Compare lanes -13 – Bio-Rad Quantity One 1-D Analysis Software User Manual
Page 110
Chapter 4. Lanes
4-13
4.3 Compare Lanes
The Compare Lanes graph allows you to superimpose the intensity profiles of any
number of lanes from any number of open images.
Select Compare Lanes from the Lane menu or toolbar, then click on the first lane
you want to display. The Compare Lanes window will open.
Note:
The image must have defined lanes for this command to work.
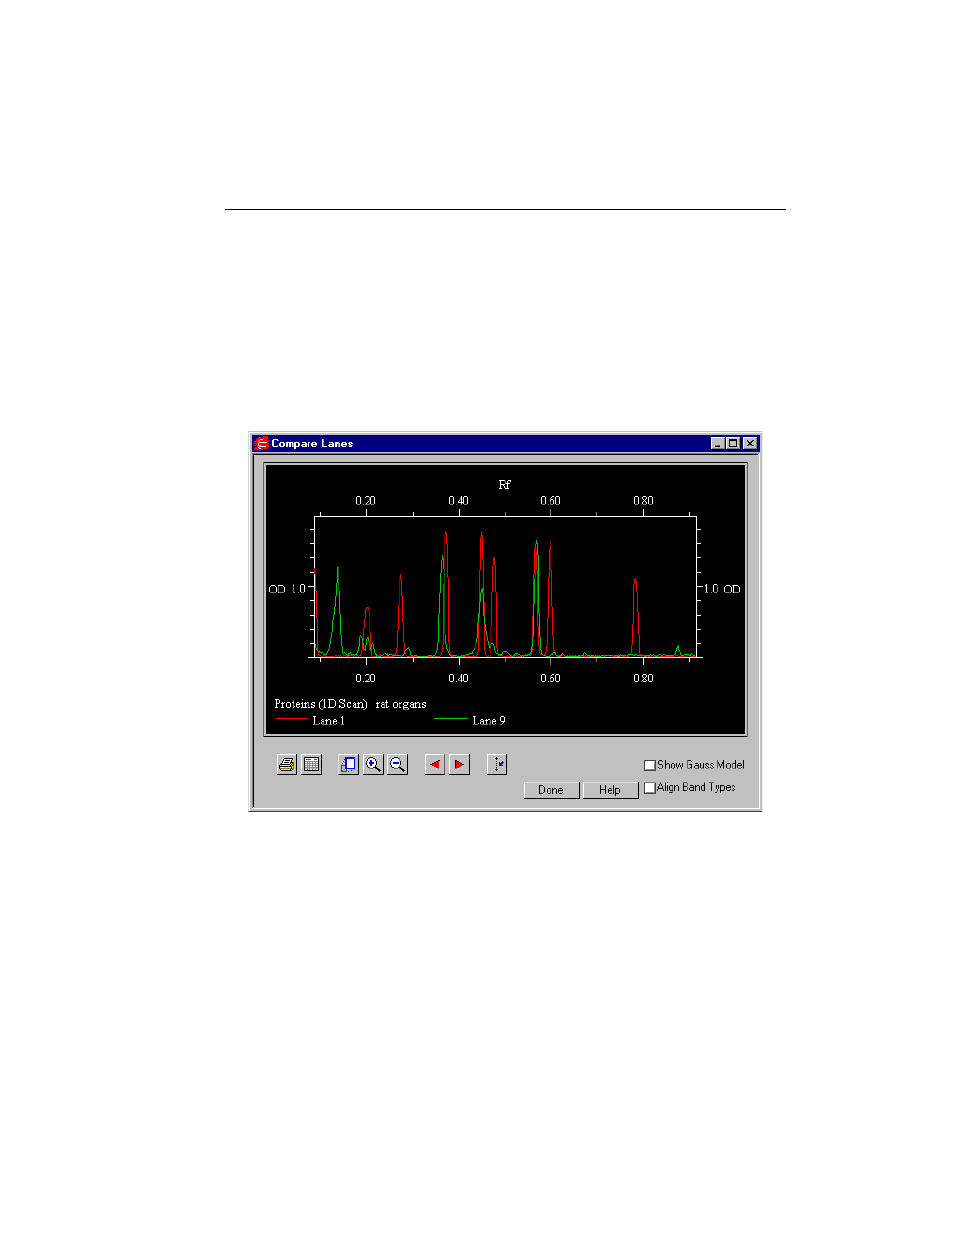
Fig. 4-12. The Compare Lanes dialog.
The X axis of the graph is the Rf value and the Y axis is the pixel intensity value at
each point along the lane. Compare Lanes automatically “best fits” lanes within the
display window to maximize the range of intensity values included in the graph. Rf
values are displayed from 0.0 to 1.0.
This manual is related to the following products: