Chapter 3 using data monitor, 1 displaying waveforms on the monitor window, 1 displaying waveforms on the monitor window -1 – Yokogawa DAQWORX User Manual
Page 79: Index, Displaying the monitor
3-1
IM WX101-01E
1
2
3
4
5
6
7
8
9
Index
Using Data Monitor
3.1
Displaying Waveforms on the Monitor Window
Data Monitor, the monitor software, displays the measured/computed data that is
currently being collected using the logger software. Data monitor offers 5 display formats
to display measured data: trend, numeric, meter, alarm, and color graph.
Displaying the Monitor
Procedure
1. In the “DAQLOGGER Manager” window, click the “MONITOR” button.
The “DAQLOGGER Data Monitor” window appears.
Measured data is displayed only during the scanning or recording operation. If
no measured data is displayed, click the “SCAN” or “RECORD” button in the
“DAQLOGGER Manager” window.
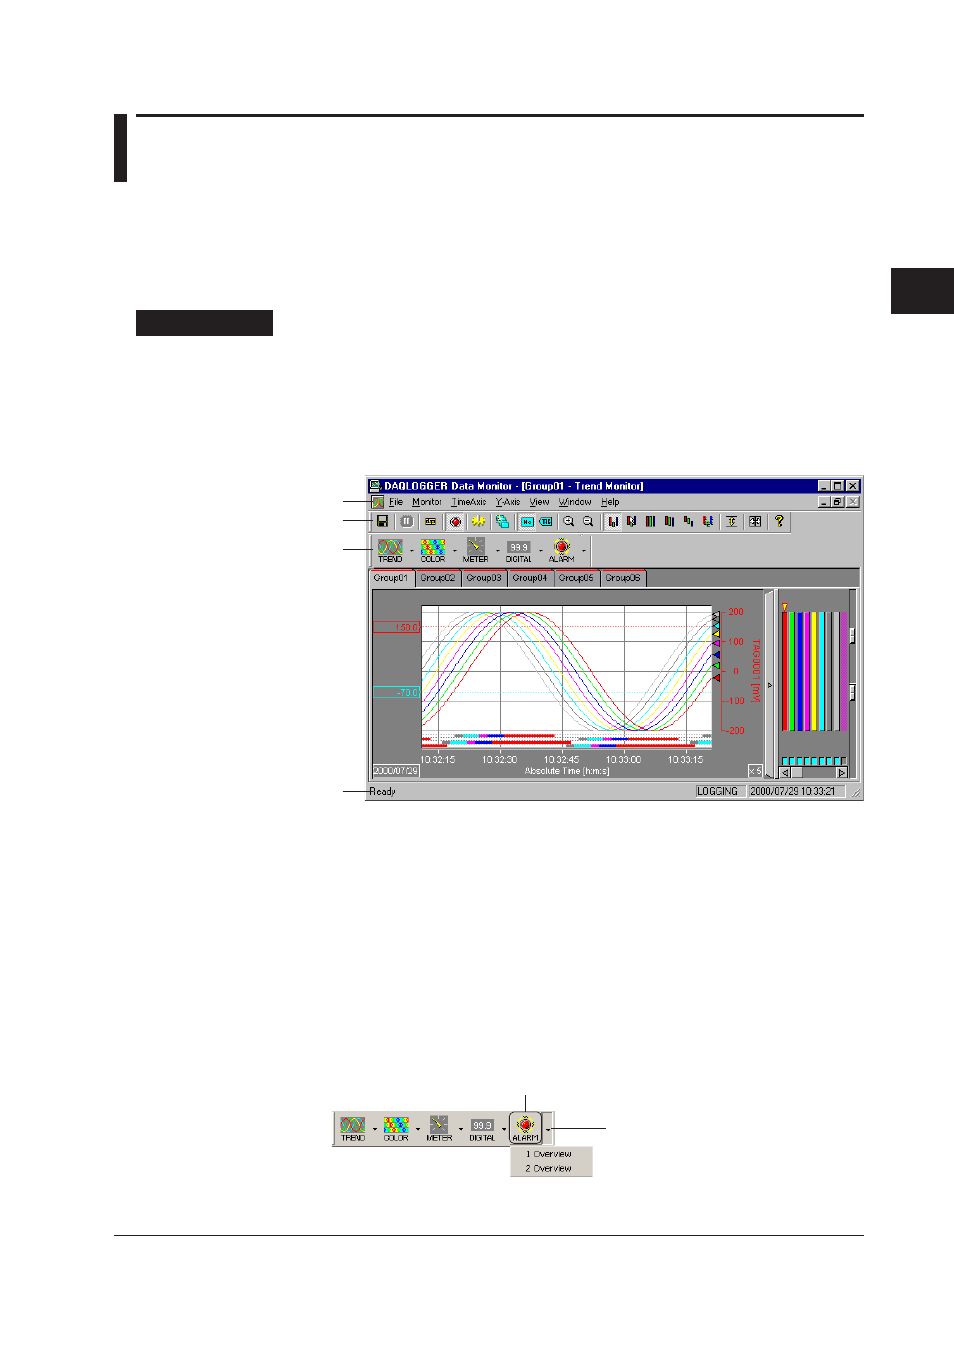
Standard Tool bar
Menu bar
Monitor bar
Status bar
• Even if the scanning operation is started without opening the monitor window, the
measured data is collected. And when the monitor window is opened, the data
collected up to that point is displayed.
• The scanning operation can also be started after opening the monitor window. For
the procedures regarding the scanning operation, see section 2.9 “
Configuring the
Logger.”
• The trend monitor can display up to 3600 data points.
2. Click the “TREND,” “METER,” “NUMERIC,” “ALARM,” or “COLOR” button on the
monitor bar.
A new monitor window of the clicked button opens.
If Internet Explorer Ver. 4.0 or after is
installed, a list box is displayed in the
right of each button.
The list box shows the currently opened
monitor window(s). If clicked, the
selected window will be displayed on
top. If Internet Explorer Ver. 4.0 or later
is not installed, you can also open these
listings by clicking the button with the
right mouse button.
Click to refresh the screen.
Chapter 3
Using Data Monitor