Displaying the waveform that is being recorded – Yokogawa DAQWORX User Manual
Page 105
4-4
IM WX101-01E
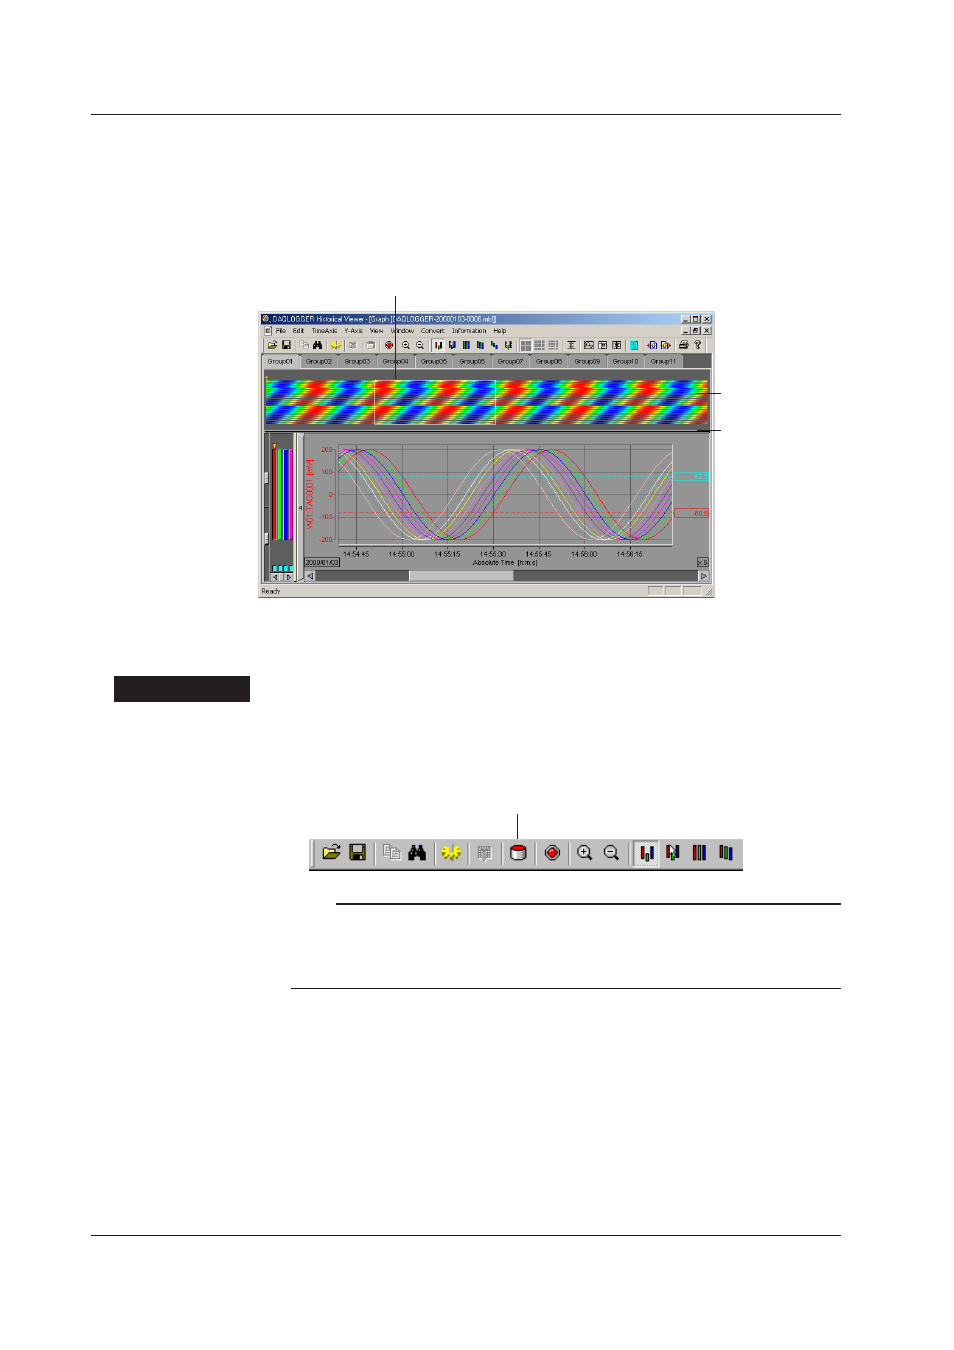
Data Overview
When the graph is displayed, pulling down the overview bar displays the data overview.
The data overview displays the loaded data values in color. When the data value
exceeds the maximum scale, the color is red. When the data value is less than the
minimum scale, the color is blue. The colors in between change from red to yellow to
green to light blue to blue.
Overview spreader
Data overview
The waveforms in the section enclosed in the white frame are displayed.
You can drag the frame or use the mouse wheel to move the waveform display range.
Displaying the waveform that is being recorded
To display the waveform that is being recorded with the logger software, do the following.
Procedure
1. Click the “Current Data” button on the toolbar or select “View” from the menu bar
then select “Current Data.”
The waveform of the data that is currently being recorded with the logger software is
displayed.
Current data button
Note
• The “Current Data” button is enabled only when the logger software is executing the
recording operation.
• Even when saved data is being displayed (see page 4-2), the data that is currently being
recorded can be displayed by clicking the “Current Data” button.
2. To update the waveform display, click the “Current Data” button again.
The newest measured data is displayed (The data is loaded from a data file).
4.1 Displaying Waveforms on the Viewer Window