Line printer report c, Co-ox, Temperature corrected values – Bayer HealthCare Rapidlab 800 User Manual
Page 588
FĆ10
800 Series Operator's Manual
Line Printer Report C
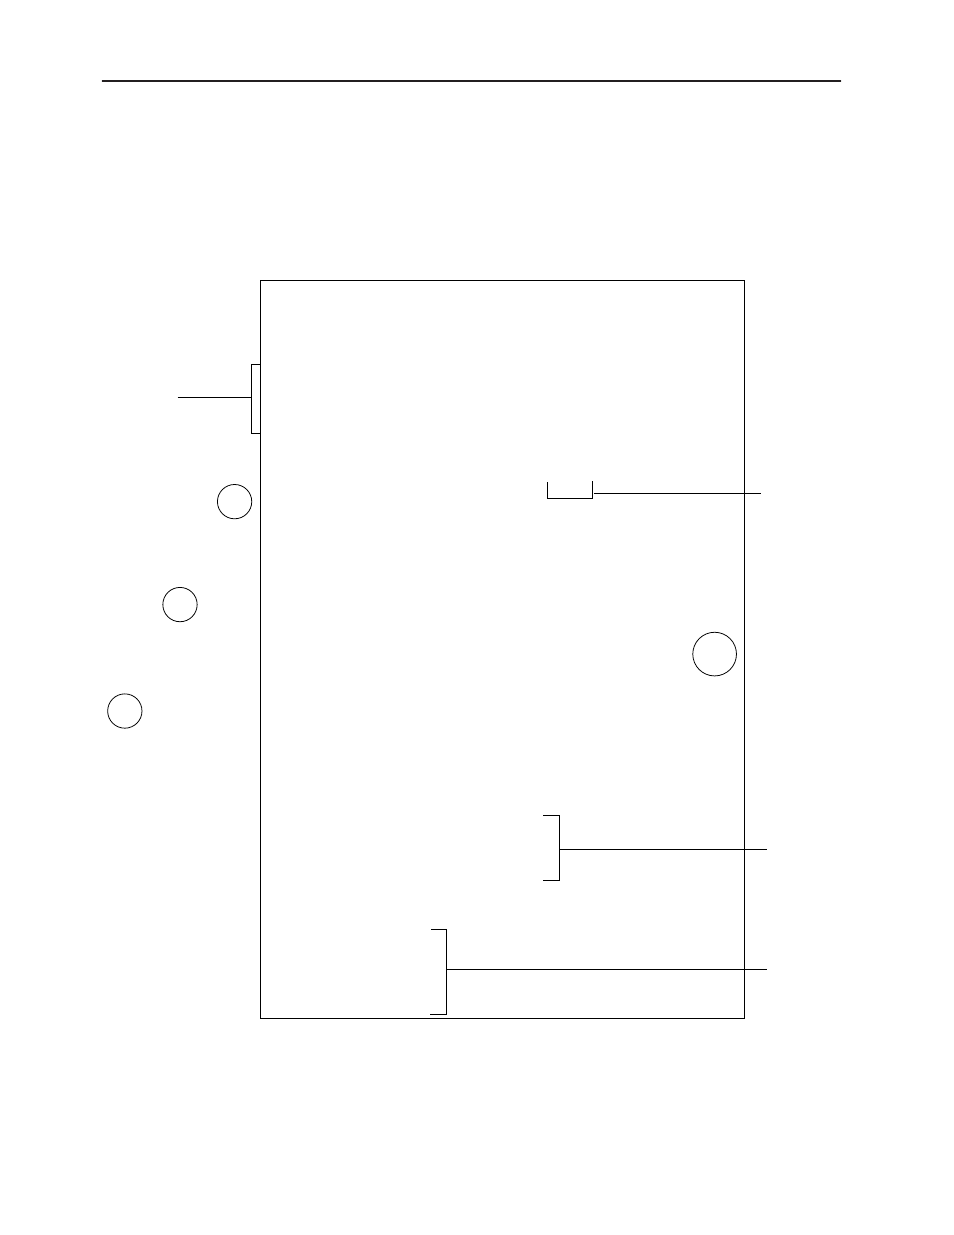
Line Printer Report C is similar to Report B, except that it includes the pH value
with the blood gas values. Figure F-8 shows an example of Line Printer Report C.
Figure FĆ8.āăLine Printer Report C
PATIENT SAMPLE REPORT APR 12 1994 12:02
Hospital Name
Hospital Address Line 1
Hospital Address Line 2
City, State Zip
Patient ID xxxxxxxxxxx
Physician ID xxxxxxxxxxx
Location xxx
Birthdate xxx xx xxxx
Age xxx
Sex x
BLOOD GAS 37
°
C Units Reference Range Corrected 38.5
°
C
pH xx.xxx (x.xxxx - x.xxxx) xxx.xx
pCO
2
xx.xxx mmHg (x.xxxx - x.xxxx) xxx.xx
pO
2
xxx.xx mmHg (xxx.xx - xxx.xx) xxx.xx
ACID/BASE 37
°
C Units Reference Range
HCO
3
-act xxx.xx mmol/L
HCO
3
-std xxx.xx mmol/L
BE(B) xxx.xx mmol/L
BE(ecf) xxx.xx mmol/L
CO-oximetry
ctHb xxx.xx g/dL
Hct xxx.xx %
sO
2
xxx.xx %
FO2Hb xxx.xx %
FCOHb xxx.xx %
FMetHb xxx.xx %
FHHb xxx.xx %
OXYGEN STATUS 37
°
C OXYGEN STATUS 38.5
°
C
ctO
2
(a) xxx.xx mL/dL
BO
2
xxx.xx mL/dL
pO
2
xxx.xx mmHg (xxx.xx - xxx.xx) xxx.xx
p50 xxx.xx mmHg
pO
2
(A-a)(T) mmHg xxx.xx
pO
2
(a/A)(T)
% xxx.xx
RI(T)
% xxx.xx
ELECTROLYTES and METABOLITES
Na+ xxx.xx mmol/L (xxx.xx - xxx.xx)
K+ xxx.xx mmol/L (xxx.xx - xxx.xx)
Ca++ xxx.xx mmol/L (xxx.xx - xxx.xx)
Ca++(7.4) xxx.xx mmol/L
Cl- xxx.xx mmol/L (xxx.xx - xxx.xx)
AnGap xxx.xx mmol/L
Glucose xxxxxx mg/dL (xxxxxxx - xxxxxx)
Lactate xx.xx mmol/L ( xx.xx - xx.xx )
ENTERED
Temp xxx.xx
°
C
ctHb xxx.xx g/dL
FIO
2
xxx.xx %
Flow xx.xxx L/min
Resp Rate xx.xx b/min
P50 xxxxxx mmHg
System xxx-xxxx Analysis Date xxx xx xxxx
Analysis Time xx:xx
Seq no xxxxx Draw Date xxx xx xxxx
Acc no xxxxx Draw Time xx:xx
Source x-xxx Operator ID xxxxxxxxxxx
.........................................................................................................
............................. . . . . .
. . . . . . . . . . . . . . . . . . .
These results
appear when
an 845, 855,
or 865 is
interfaced.
Entered
Values
Patient and
Sample Data
. . . . . . . . . . . . . . . . . . . . . . . . . . . . . . . . . . . . . . . . . . . . . . . . . . . . . . . . . . . . . . . . . . . . . . . . . . . . . . . . . . . . . . . . . . . . . . . . . . . . . . . . . . . . . . . .
. . . . . . . . . . . . . . . . . . . . . . . . . . . . . . . . . . . . . . . . . . . . . . . . . . . . . . . . . . . . . . . . . . . . . . . . . . . . . . . . . . . . . . . . . . . . . . . . . . . . . . . . . . . . . . . . .................................
CO-ox
.................................
840
850
Temperature
Corrected
Values
Temperature
Corrected
Values
. . . . . . . . . . . . . . . . . . . . . . . . . . . . . . . . .
. . . . . . . . . . . . . . . . . . . . . . . . . . . . . . . . .
...............................................................................................................
860