Yokogawa GC8000 Process Gas Chromatograph User Manual
Page 246
<4. GC-HMI (touch panel)>
4-59
IM 11B08A01-01E
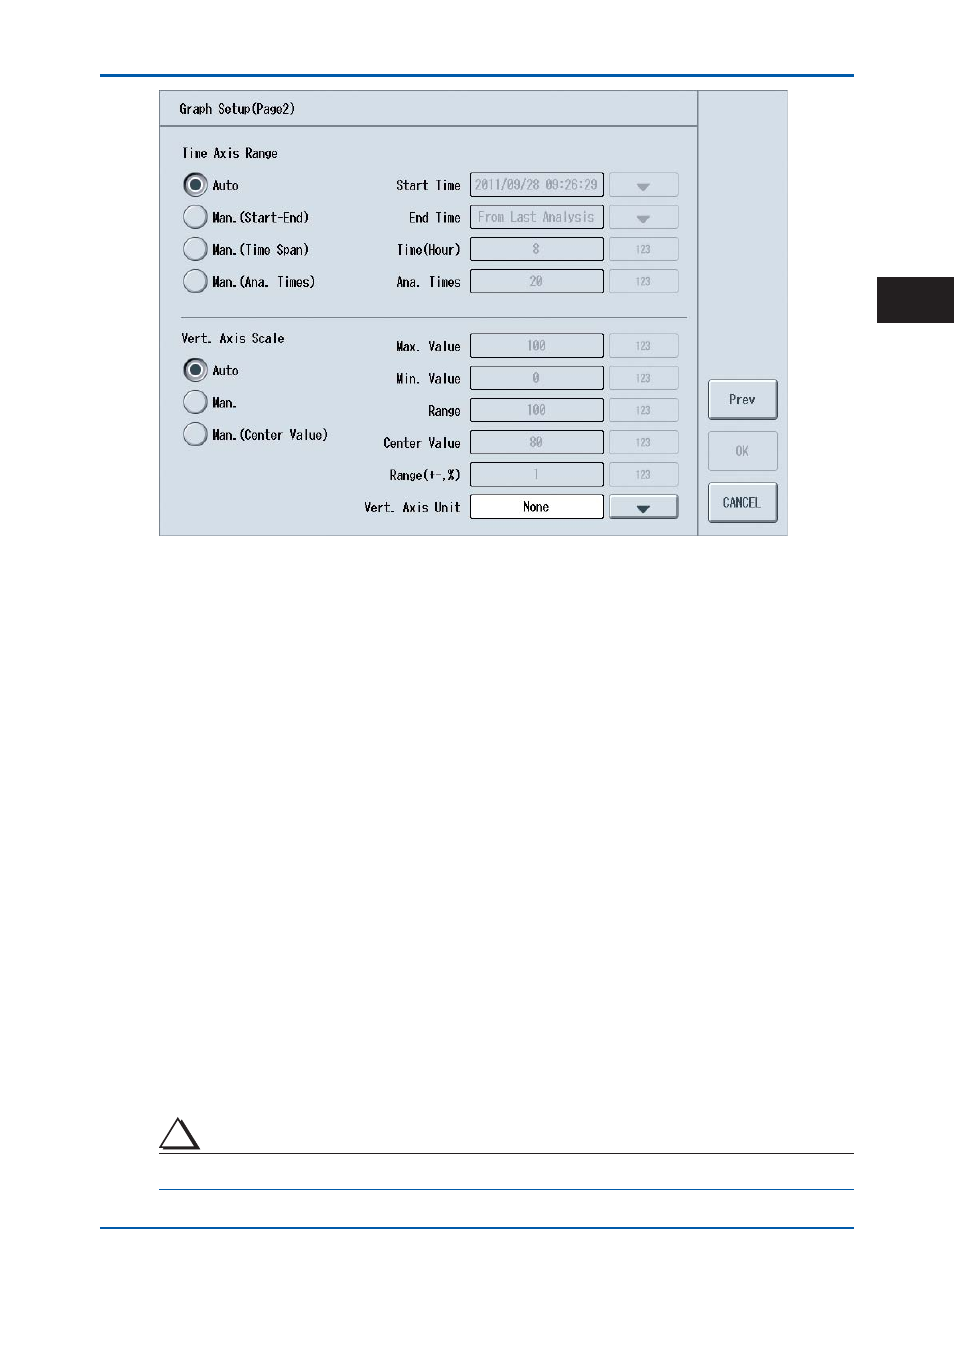
Figure 4.79
Page 2
(1) Time
Axis
Range
Select the horizontal axis (i.e., time axis) of the graph from the radio buttons: Auto, Man.
(Start-End), Man. (Time Span), or Man. (Ana. Times).
• Man.
(Start-End)
Start Time:
Press the ## button and select the analysis start time (the time to
start drawing a graph) from the displayed values.
End Time:
Press the ## button and select the analysis end time (the time to
end drawing a graph) from the displayed values.
Note: The start time must be earlier than the end time.
• Man. (Time Span)
End Time:
Press the ## button and select the analysis end time (the time to
end drawing a graph) from the displayed values.
Time (Hour):
Press the ## button and select from the range of 1 to 72 (hours).
• Man.
(Ana.
Times)
End Time:
Press the ## button and select the analysis end time (the time to
end drawing a graph) from the displayed values.
Ana. Times
Press the ## button and select from the range of 1 to 250 (analysis
times).
(2) Vert.
Axis
Scale
Select the vertical scale from the radio buttons: Auto, Man., or Man. (Center Value).
• Man:
Set the Max. Value and Min. Value.
The setting ranges are as follows:
Max. Value: 0 to 12000, Min. Value: –2000 to 10000
TIP
The upper limit must be greater than the lower limit.
2nd Edition : May 11, 2012-00
4