6 analysis result screen – Yokogawa GC8000 Process Gas Chromatograph User Manual
Page 241
<4. GC-HMI (touch panel)>
4-54
IM 11B08A01-01E
Y axis scale:
Represents the electromotive force of chromatogram. Unit: mV for
mV representation, or magnifi cation for gain representation.
Temperature/pressure axis scale:
Temperature data is in units of deg C and deg F.
Pressure data is in units of kPa and psi.
Scale up/down X axis buttons, scale up/down Y axis buttons:
These buttons scale up /down the X and Y axes, respectively.
Scale up/down X-Y axis buttons:
Scales up/down the X and Y axes simultaneously.
Show whole button:
Displays the whole of the chromatogram.
Auto scale button:
Turns on/off the auto scale function. When this function is turned
on, scale up/down settings do not work.
4.6
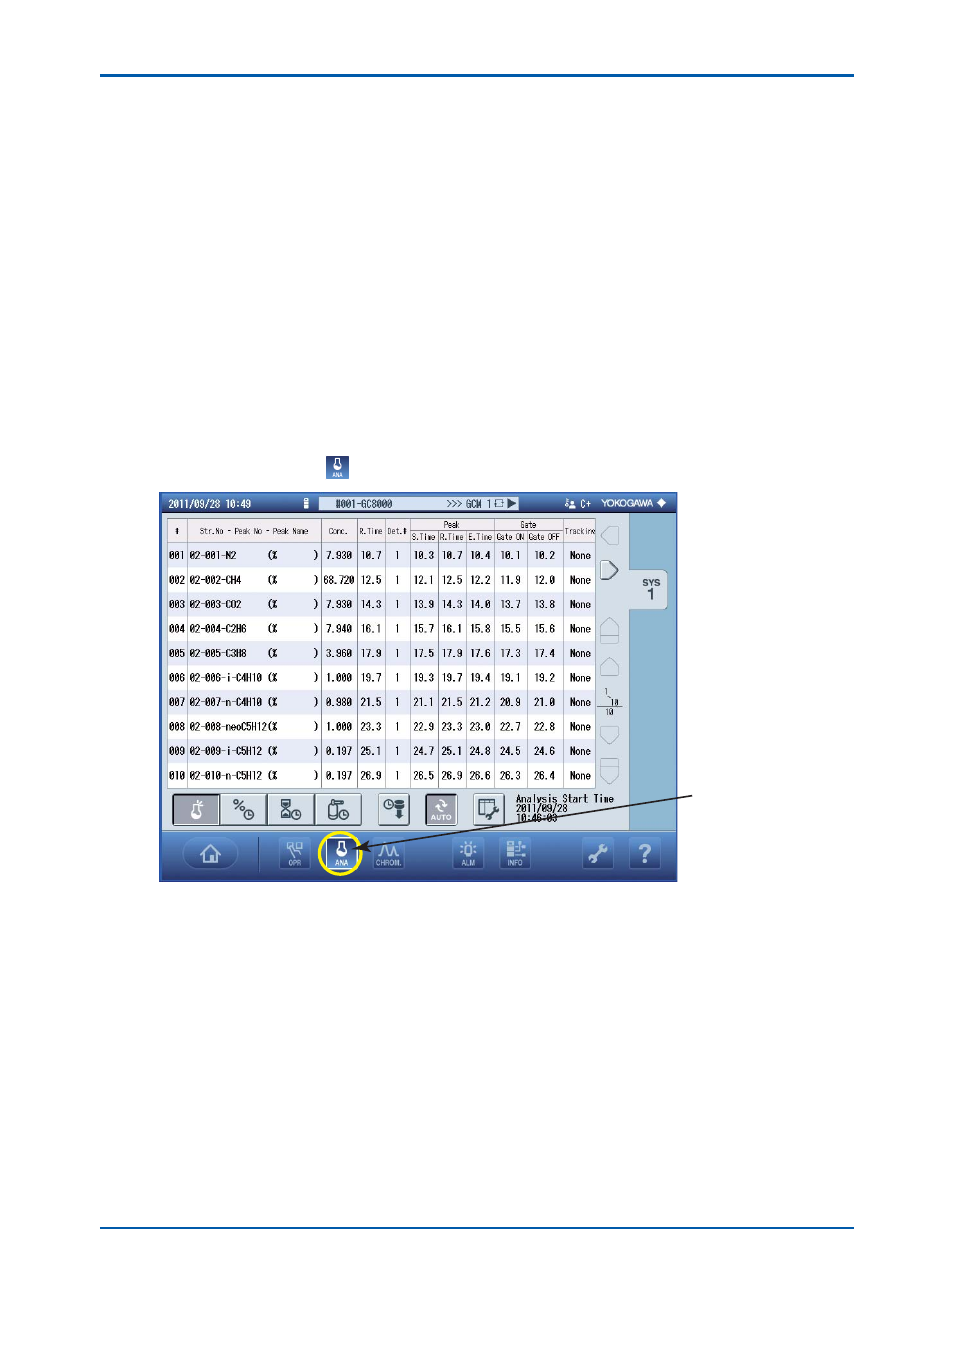
Analysis Result Screen
This screen displays the measurement results (in graph form, when you select) taken with the
active GCM. Press the
on the navigation bar to display the analysis result screen.
F0472.ai
Press this icon.
Figure 4.72
Example of Analysis Result Screen
The display screen consists of the following screens:
Analysis result screen
Concentration analysis history screen
Retention time history screen
Calibration factor history screen
The above screens are displayed by pressing the corresponding buttons located in the lower left
of the screen:
2nd Edition : May 11, 2012-00