Yokogawa Data Acquisition with PID Control CX2000 User Manual
Page 96
1-84
IM 04L31A01-01E
Note
The following information is not displayed on the 4 screen display.
•
Measured/computed values , alarm type, and cursor of the overview
•
Scale of trends
•
Measured/computed values, upper and lower limit of span, and unit of bar graphs.
•
Cursors of alarm summary, message summary, and memory summary
•
The following displays that are assigned to the “4 screens” display channel numbers even
if the setting is set to display tags.
•
Vertical trend display
•
Horizontal trend display with 7 or more channels assigned to the group
•
Bar graph display
Control Operation Display > Historical Trend Display
The waveform of the past display data
*
and event data
*
in the internal memory can be
displayed. This function is called “Historical trend.”
Methods of Displaying the Historical Trend
The following four methods are available in displaying the historical trend.
• Display from the alarm summary.
• Display from the message summary.
• Display from the memory summary.
• Recall from the screen menu.
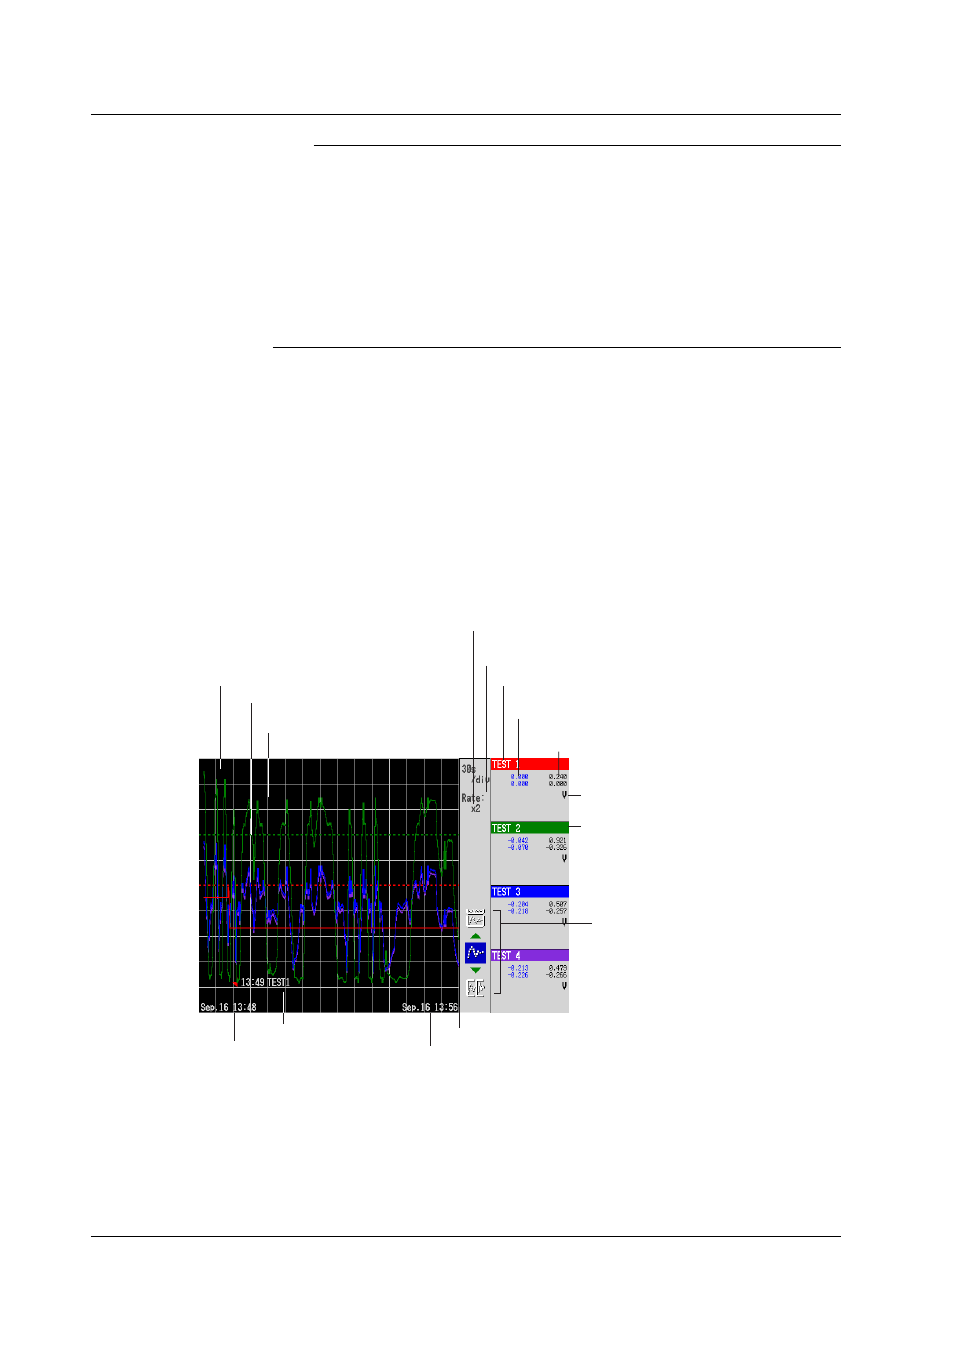
Information Displayed on the Historical Trend
Alarm information and scales are not displayed on the historical trend display.
Zoom factor of the time axis
(using the display selection menu)
Time axis
Channel No. or tag name
Measured/computed value
(max. or min. value atthe cursor position)
Measured/computed value
(max. or min. value over the entire display range)
Waveform display
(channel display color)
The background color is the opposite of
the trend display color. (black or white)
Position of the newest displayed data
Date and time at the left
end on the time axis
Date and time at the right end on the time axis
Screen switch display
Up arrow key:
Display the all data display
(see the next page)
Down arrow key:
Half screen display of current
and historical trend (see the next page)
Message
Trip line
Unit
This area is displayed
using the channel
display color.
1.16 Display Function