Yokogawa Data Acquisition with PID Control CX2000 User Manual
Page 109
1-97
IM 04L31A01-01E
Explanation of Functions
3
2
1
4
5
6
7
8
9
10
11
12
13
14
Numerical Display
The range of displayed values of report data is from –9999999 to 99999999 excluding
the decimal point. The decimal point position corresponds to the position of the decimal
point of the upper and lower limit span or upper and lower limit scale (for scaling).
However, special displays are used for cases given in the table below.
• Measurement channel
Item
Data Condition of Measurement Channels
Displayed Output
Average value
When all of the data are measurement errors or over range (Blank)
Maximum/Minimum Value • When all of the data are measurement errors
(Blank)
• Positive (+) over range
99999
• Negative (-) over range
–99999
Sum
• When all of the data are measurement errors or
(Blank)
over range
• When the sum value exceeds 3.4E + 38
9.999999E+99
• When the sum value is below –3.4E + 38
–9.999999E+99
• Computation channel
Item
Data Condition of Computation Channels
Displayed Output
Average value
When all of the data are computation errors or
(Blank)
computation overflow
Maximum/Minimum value
• When all of the data are computation errors
(Blank)
• When the maximum value exceeds 99999999
999999999
• When the minimum value is –9999999
–99999999
The decimal position that was specified when the span for the channel
was specified applies to the maximum and minimum values. For
example, if the span setting of the channel is “200.0,” then “99999999” is
output when the value exceeds “99999999.9” and “–99999999” is output
when the value is below “–999999.9.”
Sum
• When all of the data are computation errors or
(Blank)
computation overflow
• When the sum value exceeds 3.4E + 38
9.999999E+99
• When the sum value is below –3.4E + 38
–9.999999E+99
Displaying and Saving Report Data
The report data in the internal memory can be displayed on the LCD of the CX2000. In
addition, the report data in the internal memory can be saved to an external storage
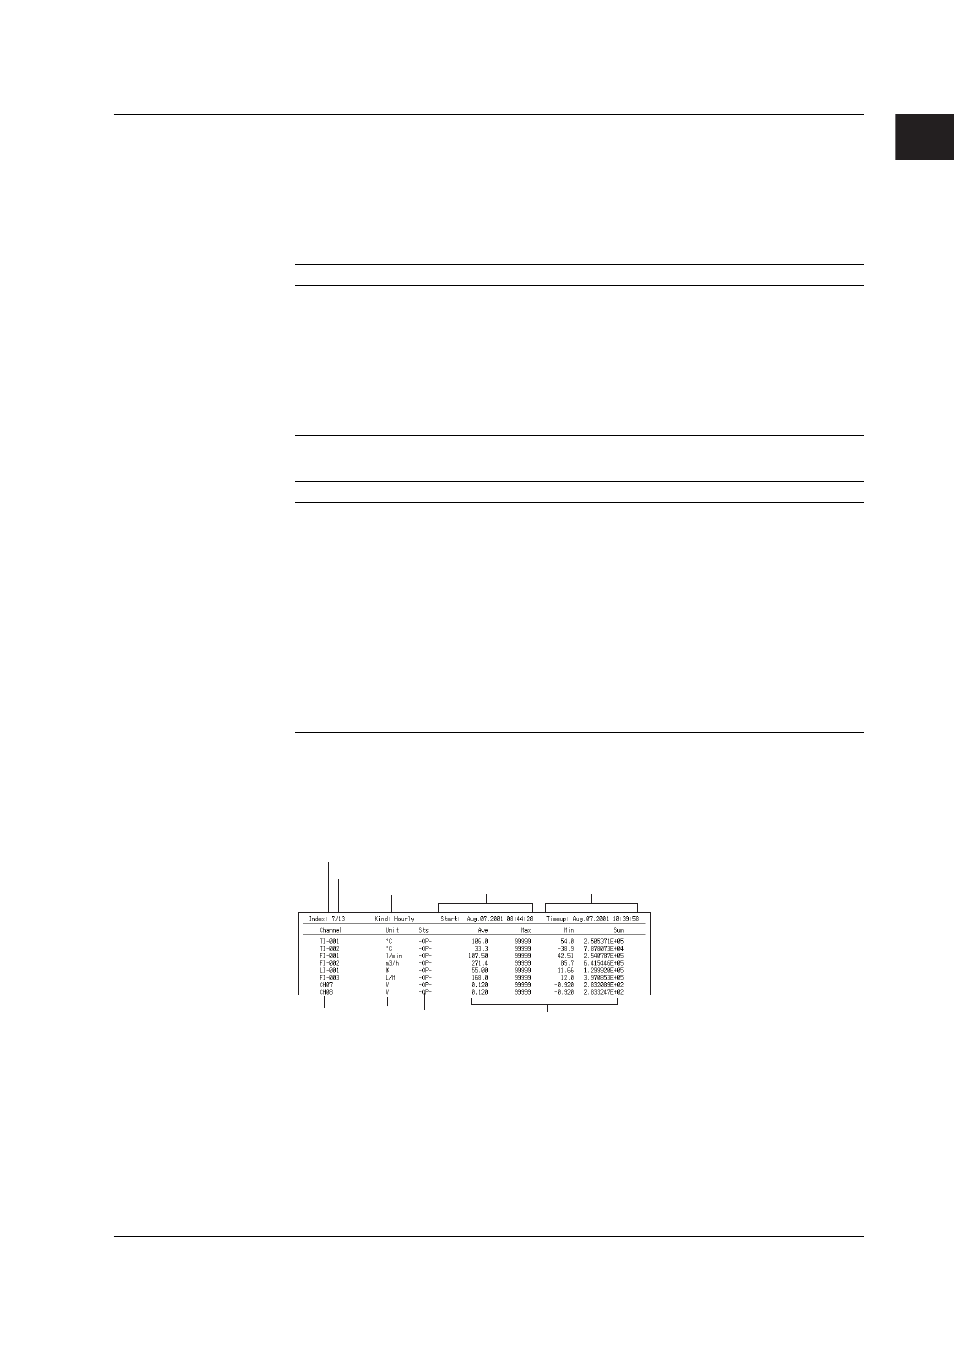
medium. The figure below shows an example of an hourly report.
Number of the report data being displayed
Number of report data in the internal memory
Type of report
Channel No. or
tag name
Unit
Start date/time
Report data status
Date/time of the
newest report
Average, maximum, minimum, and sum
1.18 Computation and Report Functions (Option)