Yokogawa Data Acquisition with PID Control CX2000 User Manual
Page 95
1-83
IM 04L31A01-01E
Explanation of Functions
3
2
1
4
5
6
7
8
9
10
11
12
13
14
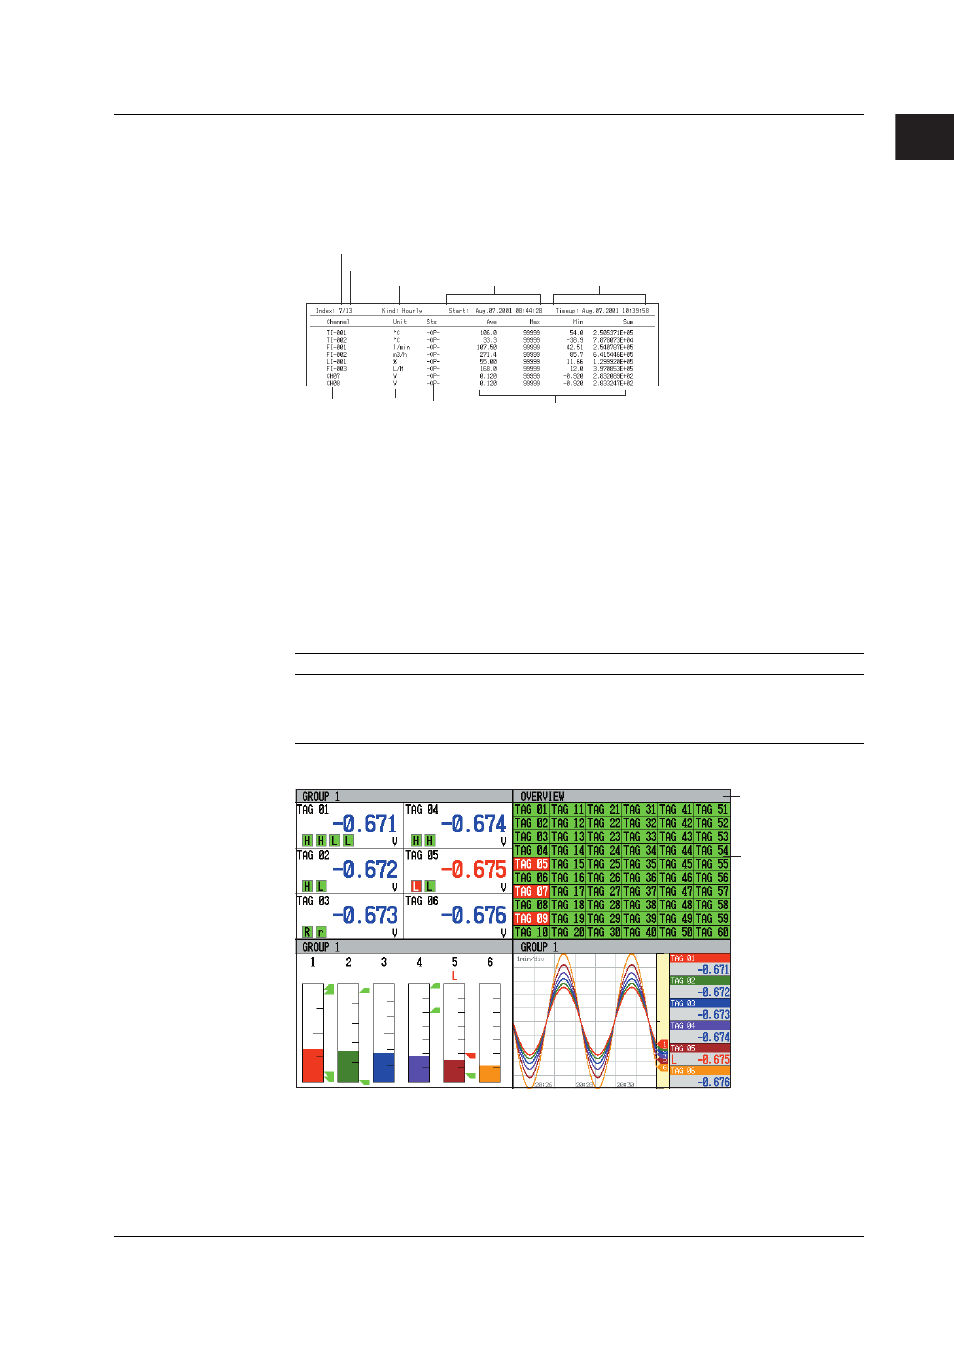
Control Operation Display > Report Data (Optional Function)
Report data residing in the internal memory can be displayed.
The report function is used to write the average, minimum, maximum, and sum at
specified intervals for the specified channels. Reports can be made hourly, daily,
weekly, or monthly.
Number of the report data being displayed
Number of report data in the internal memory
Type of report
Channel No. or
tag name
Unit
Start date/time
Report data status
Report date/time
Average, maximum,
minimum, and sum
Control Operation Display > Four Screen Display
Up to four different display formats can be displayed at once. The formats that can be
displayed are trend display, digital display, bar graph display, overview, alarm summary,
message summary, memory summary, and control operation display (control group
display, overview display, DI/DO status display, control operation summary, program
event summary display). The data of different groups can be displayed in quadrants that
are showing the trend display, digital display, or bar graph,
The display condition of the 4 screen display can be registered (up to four
configurations). The registered configuration can be recalled to the display. The initial
setting is as follows:
Display Name
Displays Shown
MIX
Trend (group 1), digital (group 1), bar graph (group 1), and overview
ALL TREND
All trend displays (groups 1 through 4)
ALL DIGITAL
All digital displays (groups 1 through 4)
ALL BAR
All bar graph displays (groups 1 through 4)
Example of a “MIX” display
Displays the display
name or group name.
Press the left or right arrow key to display other “4 screen” displays.
Displays can be
assigned
to each area.
1.16 Display Function