Yokogawa Data Acquisition with PID Control CX2000 User Manual
Page 278
8-21
IM 04L31A01-01E
Operations for Changing the Displayed Contents
8
Setup Procedure
1. Use the
arrow keys
to move the cursor (blue) to the item box you wish to change.
The selections are displayed at the bottom section of the display.
2. Press the
soft key
corresponding to the value you wish to select.
The box for the item you changed turns yellow, and the cursor moves to the next
item.
3. Repeat steps 1 and 2 to change the value of all the items you wish to change.
4. Press the
DISP/ENTER key
to confirm the changes.
The boxes for the items you changed turn from yellow to white, and the cursor
returns to the first item box.
Setup Items
Setting the Scale Division, Bar Graph Base Position, and Scale Position of Trend Displays
• First-CH/Last-CH
Set the target channel (common with the [Zone] setting).
• Graph
• Division
Set the number of main scale marks on the trend display and the number of scale
marks on the bar graph from [4] to [12]. In addition to the values of [4] to [12],
[C10] is available. When [C10] is selected, the scale is equally divided into 10
sections by main scale marks, and scale values are indicated at 0, 30, 50, 70, and
100% positions on the trend display.
Note
If the number of divisions is set from [8] to [12], scale values are displayed every other main
scale mark. In addition, the upper and lower limits of the scale are always displayed at the
ends of the scale.
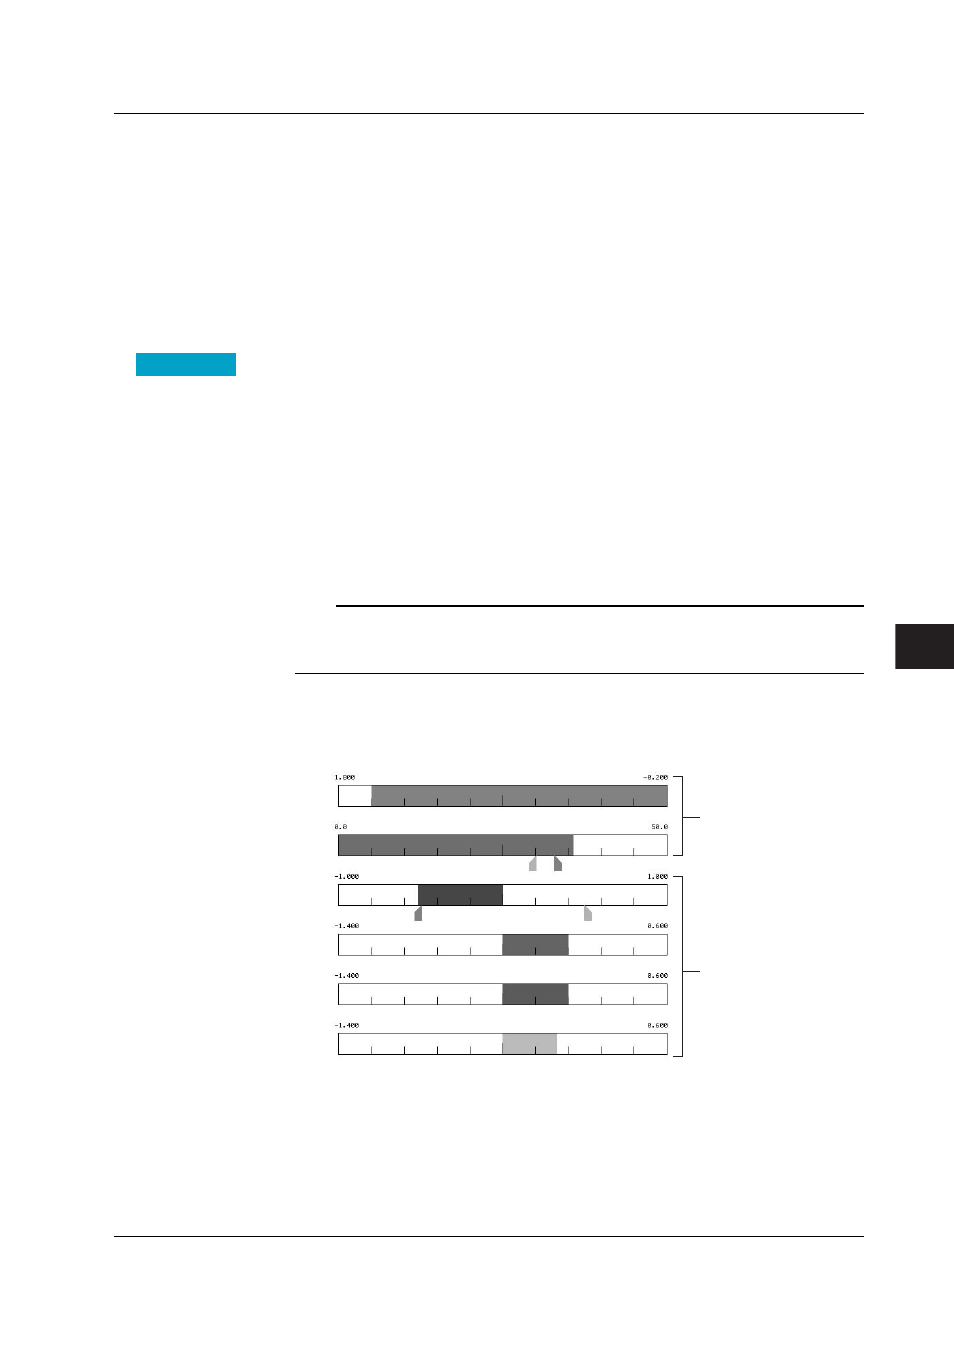
• Bar graph
Set the base position of the bar graph when set to horizontal display to [Normal] or
[Center]. When the bar graph is displayed vertically, the base position is fixed to
[Normal] (the bottom of the bar graph is the base position).
Base position: Normal
The base position is
either the left edge or
the right edge of the
display span whichever
the value is smaller.
Base position: Center
The base position is the
50% position of the
display span.
• Scale position
Select the scale display position on the trend display from [1] to [10]. When the
trend waveform is displayed horizontally, the right end is [1] and the left end is [10].
When the trend waveform is displayed vertically, the top is [1] and the bottom is
[10]. Select [Off] if you do not wish to display the scale.
8.13 Measurement Function > Setting the Scale Division, Bar Graph Base Position, Scale Position of Trend
Displays