Yokogawa Data Acquisition with PID Control CX2000 User Manual
Page 90
1-78
IM 04L31A01-01E
Updating the Waveform and Updating the Numerical Display
One division on the CX2000 consists of 30 dots along the time axis on the LCD. The
displayed waveform is updated at an interval corresponding to one dot. This interval is
determined by the time corresponding to one division (referred to as the display update
rate). The relationship between the display update rate and the speed of movement of
waveforms is as follows. Measured/computed values of the numerical display are
updated every second (every 2 s if the scan interval is set to 2 s on the).
Display Update Rate (/div)
1 min 2 min 5 min 10 min 20 min 30 min 1 h
2 h
4 h
10 h
Speed of Movement of
594
297
119
59
30
20
10
5
2.5
1.0
Waveforms (approximate value, mm/h)
Note
The speed of movement of the trend display along the time axis is derived from the following
equation given the dot pitch of the LCD (0.33 mm).
The speed of movement of the trend display along the time axis = 30 (dots) × 0.33 (mm) × 60
(min)/display update rate (min)
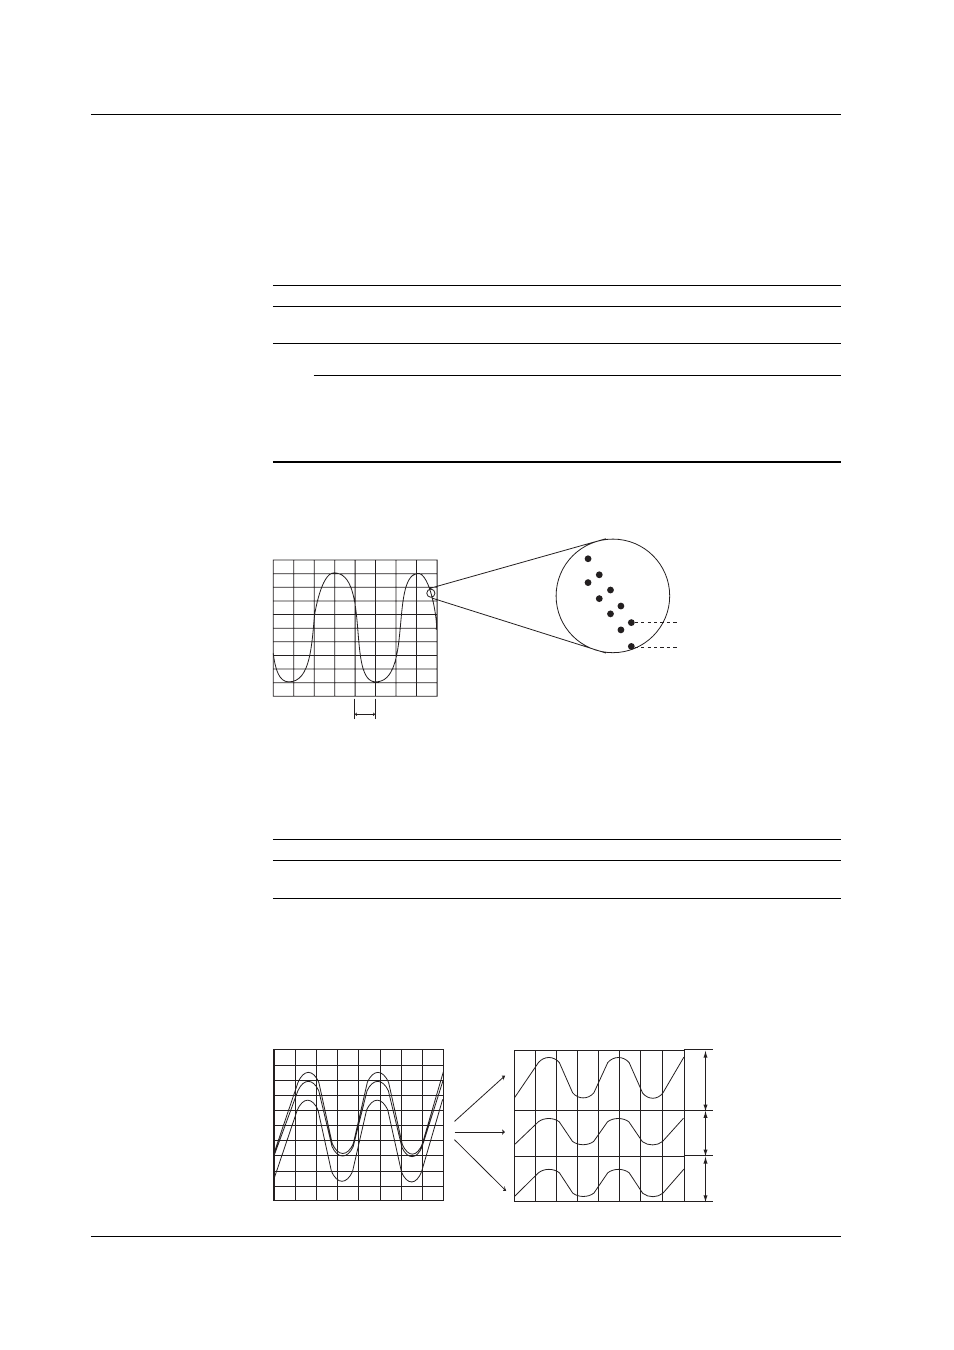
Display Format of Waveforms
The data shown on the display consists of maximum and minimum values of the data
that is sampled at the scan interval, within the time period corresponding to one dot.
{
{
1 minute
1 division (30 dots)
If the display update rate is set to 1 minute, the time corresponding
to 1 dot (sampling interval of display data) is 2 s. For example,
if the scan interval is 250 ms, the input signal is sampled 8 times
within a 2-s interval. The maximum and minimum values of the data
sampled eight times are used as display data.
2 s (1 dot)
Maximum value
Minimum value
The time period corresponding to one dot is called “the sampling interval of displayed
data.” The sampling interval of displayed data is determined by the display update
interval. The relationship between the display update rate and the sampling interval of
displayed data is as follows:
Display Update Rate (/div)
1 min 2 min 5 min 10 min 20 min 30 min 1 h
2 h
4 h
10 h
Sampling interval of
2
4
10
20
40
60
120 240 480 1200
displayed data (s)
Zone Display
The waveform display range is called a zone. You can display channels by setting a
zone for each channel. Displaying the waveforms in separate zones facilitates reading
of the waveform. In the example in the figure, channel 1 is displayed in the 0 to 30%
zone, channel 1 in the 30 to 60% zone, and channel 3 in the 60 to 100% zone.
Zone 2
Zone 1
Zone 3
100%
Time axis
30%
60%
100%
0%
0%
Time axis
When zone display is not used
When zone display is used
CH3
CH2
CH1
1.16 Display Function