Yokogawa Data Acquisition with PID Control CX2000 User Manual
Page 89
1-77
IM 04L31A01-01E
Explanation of Functions
3
2
1
4
5
6
7
8
9
10
11
12
13
14
Control Operation Display > Trend Display
Displayed Information and Display Direction
In addition to the waveforms of measured/computed data, PVs, SPs, and OUT of
internal/external control loops are also assigned to channels and displayed. The display
direction of the waveform can be set to horizontal or vertical as show in the following
figure. Numeric values can be displayed along with waveforms.
Note
For a description of the assignment of internal control channels (internal loop channels) and external
control channels (external loop channels), see channel assignment explanation on
page 1-89
.
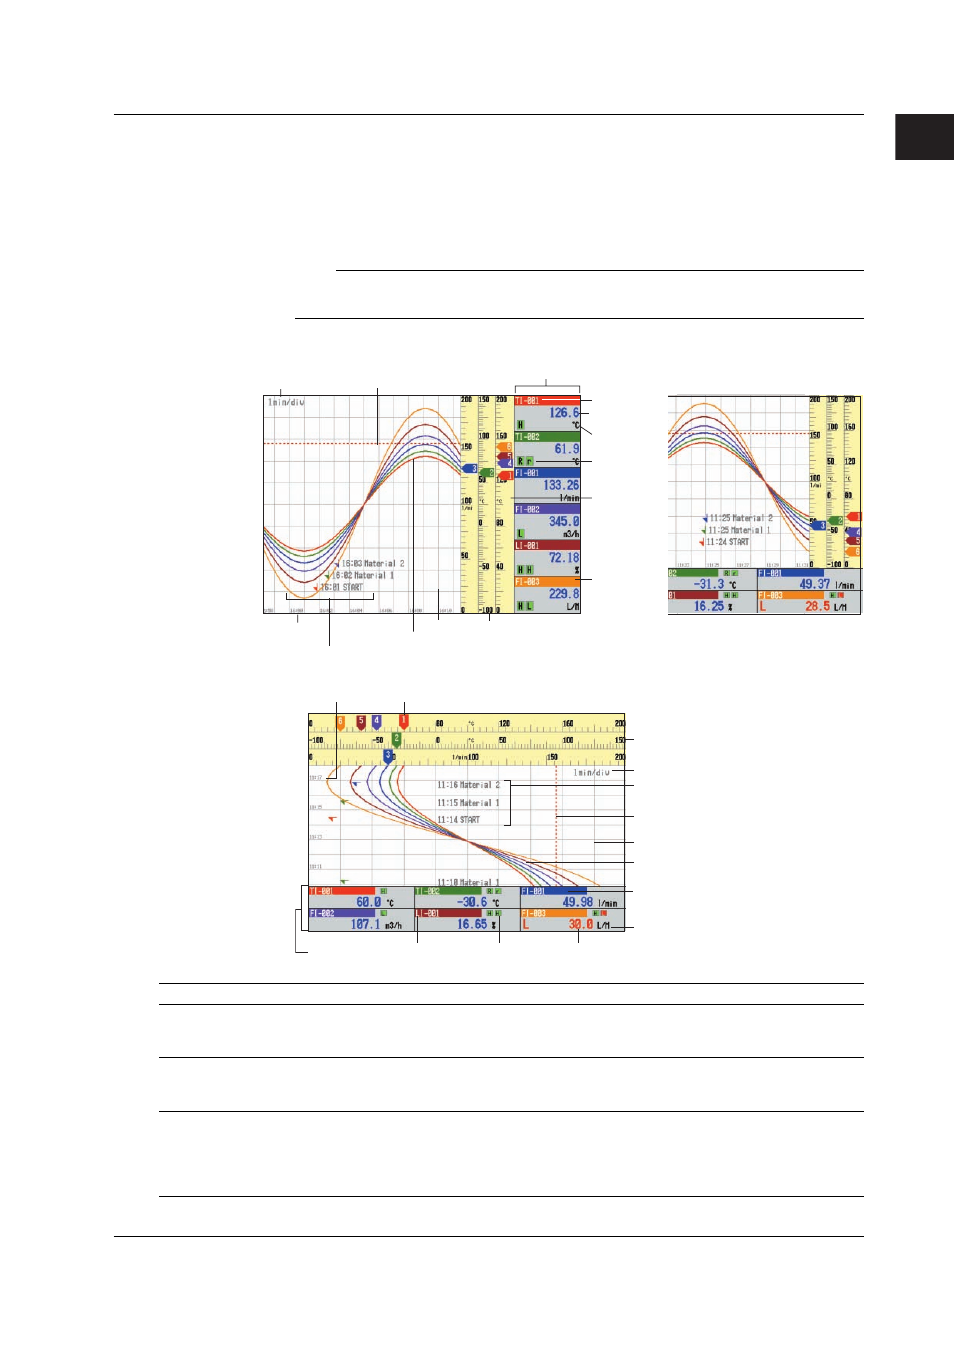
Trend (Horizontal) Display
Channel No. or
tag name
Measured or
computed value
Unit
Specified
alarm
Needle
(displayed
using the
channel
display color)
This area is
displayed
using the
channel
display color.
Message (message mark, time, and message)
Trip line
Grid
Waveform (displayed using the channel display color)
Scale
Time
Display update rate
Type 1
Type 2
Numerical
display section
Trend (Vertical) Display
Scale
Display update rate
Waveform (displayed using
the channel display color)
Needle (displayed using the channel display color)
Trip line
Unit
This area is also displayed using
the channel display color.
Message (message mark,
time, and message)
Channel No. or
tag name
Time
Numerical display
section
Specified alarm Measured or computed value
Grid
Displayed Information
Description
Message
Messages specified by the user can be displayed at arbitrary points in time. For example, by
displaying a message when a certain operation is carried out, the point at which the operation is
carried out can be seen visually. Displayed messages are saved.
Trip line
You can display a line to indicate a particular value of interest (trip line) for each group. You can
select the thickness of the displayed line from three types: 1, 2, or 3 dots. Up to four trip lines can
be displayed on a single group.
Scale
A scale appropriate for the measured item can be displayed for each channel. The number of
divisions of the display scale created by the main scale marks can be set to a value in the range 4
to 12 divisions (also applies to the bar graph display). Medium and small scale marks are
displayed in between the main scale marks. You can select whether or not to display the scale
for each channel and the display position.
1.16 Display Function