Control operation display > bar graph display – Yokogawa Data Acquisition with PID Control CX2000 User Manual
Page 92
1-80
IM 04L31A01-01E
Control Operation Display > Bar Graph Display
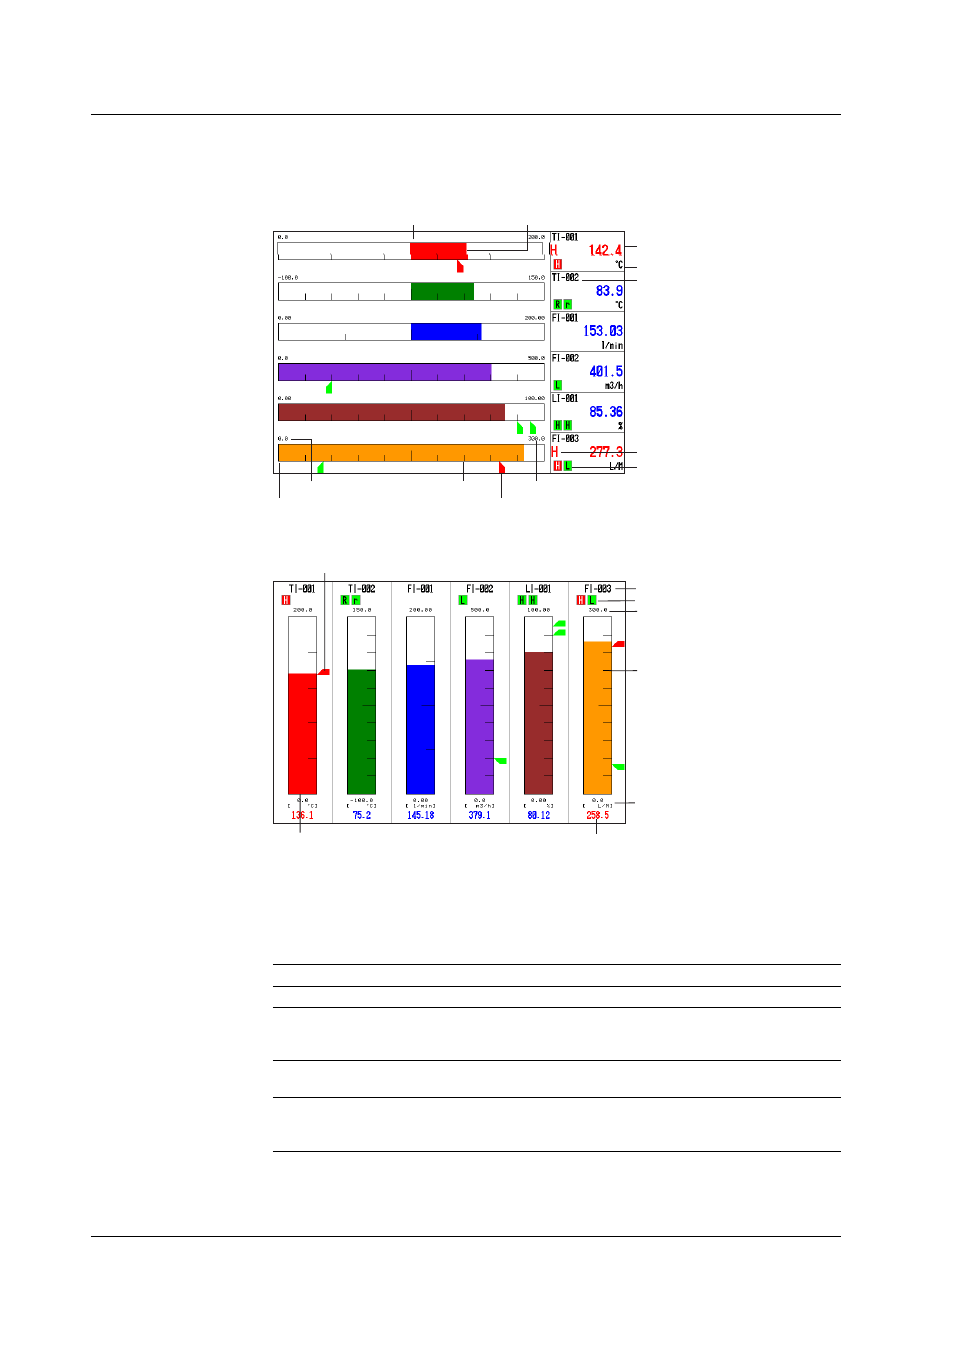
Displays the measured, computed, and control data using bar graphs.
Bar Graph (Horizontal) Display
Unit
Alarm that is occurring
Scale
Left end value of the scale
Bar graph reference position
(when set to "standard")
Right end value of the scale
Specified alarm
Channel No. or tag name
Measured or
computed value
Alarm setpoint mark
Bar graph reference position
(when set to "center")
Bar graph (displayed using
the channel display color)
Bar Graph (Vertical) Display
Alarm mark
Measured or computed value
Channel No. or tag name
Bar graph (Channel display color)
Bottom scale value
and unit
Scale
Top scale value
Alarm setpoint mark
Updating of the Bar Graph and Numerical Displays
Measured/computed values and bar graphs are updated every second (every 2 s if the
scan interval is set to 2 s).
Displayed Information
The following items can be displayed:
Function
Description
Display direction
The bar graph can be displayed vertically or horizontally.
Reference position When the bar graph is displayed horizontally, the starting point of the bar
(reference position) can be set to standard (Left or right end of the scale,
whichever the value is smaller) or the center.
Display color
The displayed color of bar graphs can be specified for each channel. The
display color is common to the trend display color.
Scale display
Main scale marks are displayed for each channel. You can select the number
of divisions created by the main scale marks from 4 to 12. This is common
with the number of scale divisions of the trend display.
1.16 Display Function