Step 7: look at the results from end 1 – Fluke Networks CertiFiber Pro Users Manual User Manual
Page 73
Chapter 2: Get Started
Tutorial: Do a Bi-Directional OTDR Test
51
Step 7: Look at the Results from End 1
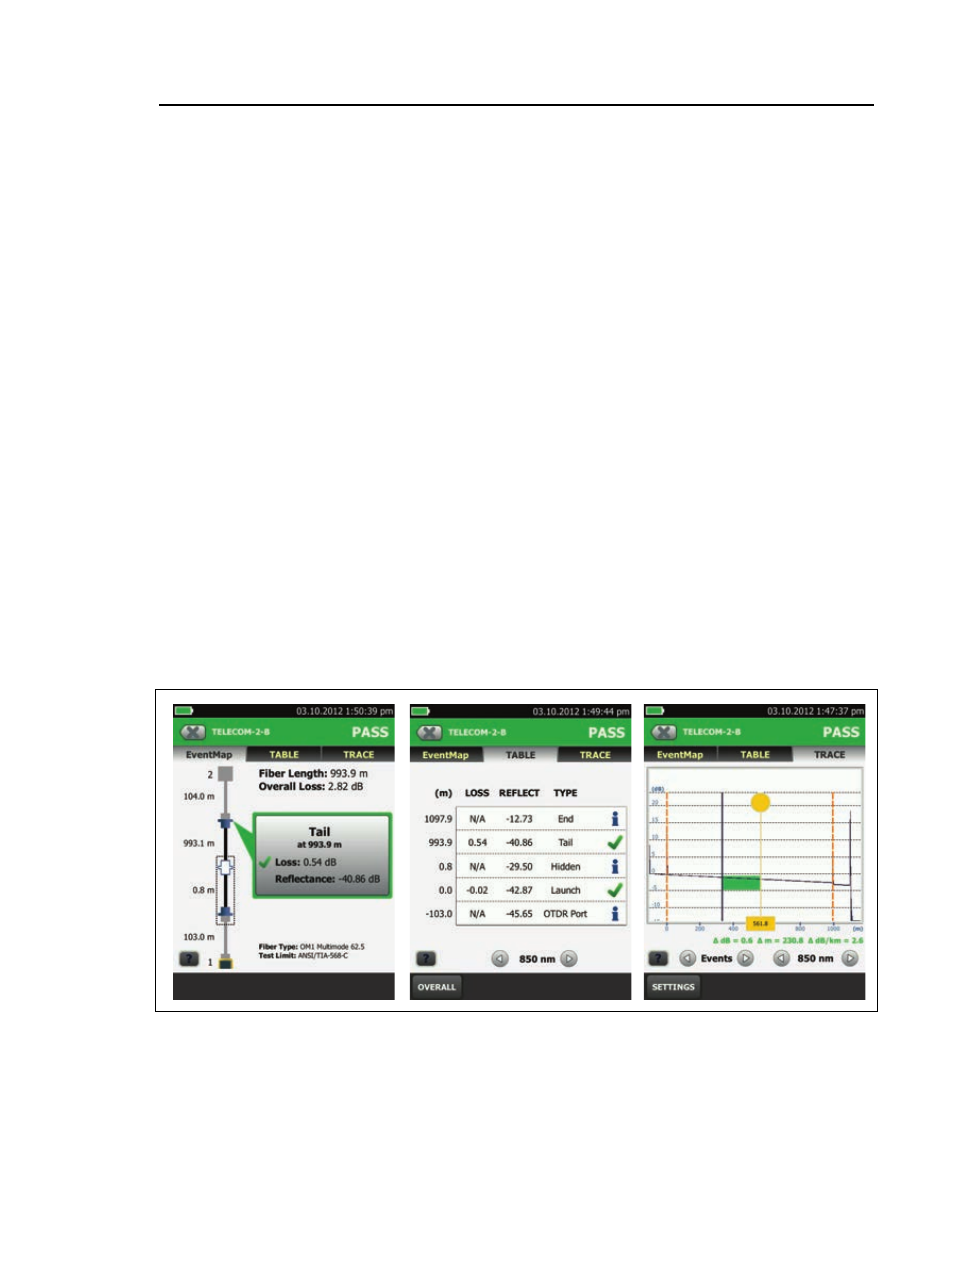
The tester shows the OTDR results in three formats (Figure 18):
EventMap: Shows a diagram of the events on the fiber, the
fiber length, and the overall loss of the fiber.
Use this screen to quickly locate connectors and faults on the
fiber. To see details for an event, tap the event on the map, then
tap the information window for the event.
TABLE: Shows a table of the events on the fiber.
Use this screen to quickly see measurements for all events and
see the types of events that are on the fiber. The table includes
the distance to the event, the loss of the event, the size of the
reflection from the event, the type of the event, and a pass/fail
status. To see details for an event, tap the event in the table.
TRACE: Shows the OTDR trace.
Use this screen to examine events and make other
measurements.
GPU26.EPS
Figure 18. Examples of the EventMap, TABLE, and TRACE Screens